All published articles of this journal are available on ScienceDirect.
T1 and T2 Mappings in the Early Diagnosis of Achilles Tendinosis
Abstract
Objective:
The purpose of this study was to compare T1 and T2 relaxation times of normal and pathologic Achilles Tendon (AT) in order to evaluate the ability of these methods to detect early Achilles tendon tendinosis.
Materials and Methods:
Forty-eight subjects were included in this study. Twenty-two subjects were classified as normal group and twenty-six subjects as patient group with tendinosis. MR examination was performed by 3 Tesla scanner using a 12 channel head coil. For relaxation times quantification, we used a sagittal 3D FLASH variable flip angle gradient echo UTE sequence (3D VFA-GE UTE) for T1 mapping and a sagittal Multi Echo Spin Echo sequence (MESE) for T2 mapping. Relaxation times were quantified using two different algorithms written in MATLAB. P value < 0.05 was considered statistically significant.
Results:
Our results showed a statistically significant difference in T1 and T2 values for the normal group compared to the patient group (p<0.05). Mean values of T1 and T2 were 571.69 ms and 24.16 ms for the normal group and 818.10 ms and 32.43 ms for the patient group, respectively. Results reported no correlation (r=0.193) for T1 mapping and a positive significant moderate correlation (r=0.542, p=0.000) for T2 mapping between the normal and patient groups. T1 and T2 showed no correlation in the normal group (r= 0.091, p=0.489) and a positive significant weak correlation in the patient group (r=0.263, p=0.048).
Conclusion:
We concluded that T1 and T2 relaxation times are relatively sensitive to diagnosis degenerative changes in the AT and T1 is more sensitive to AT tendinosis compared to T2.
1. INTRODUCTION
Injuries of the Achilles Tendon (AT) are painful and can seriously hamper the activities of daily life. They may arise because of a variety of degenerative changes in the tendon composition including an increase in stiffness of the interfascicular matrix, an increase in collagen cross-linking and a reduction in collagen fibril crimp angle [1-3].
In the early stages of AT degeneration, it is difficult to detect the small morphological changes using ultrasound or conventional Magnetic Resonance Imaging (MRI). Relaxations Times such as T1 and T2 are sensitive to alteration or disruption of the Extracellular Matrix (ECM). Recently, quantitative assessment of AT injuries using biochemical sensitive MRI techniques presents the best opportunity to diagnose early microscopic degenerative changes of AT and follow-up of patients after treatment.
In the present work, we studied the biochemical changes in the components of AT using parametric MRI techniques. The goal was to measure and compare T1 and T2 relaxation times in normal people and patients with tendinosis and to evaluate their ability in the early diagnosis of AT tendinosis.
2. MATERIALS AND METHODS
2.1. Study Group
This prospective study was approved by the local Ethics Committee. Verbal and written informed consent was obtained from each patient.
A total of forty-eight subjects were scanned between January 2017 and January 2018 (27 right ankles and 21 left ankles). Twenty-two subjects (female, 13; male, 9; right, 12; left, 10; mean age, 37.9±16.6 years; Body Mass Index (BMI), 23.5±3.7 kg/ m2) were classified as the normal group upon clinical and ultrasound assessment. Twenty-six subjects (female, 20; right, 15; left, 11; male, 6; mean age, 49.31±14.66 years; BMI, 29.73±5.86 kg/ m2) were classified as the patient group with Achilles tendon tendinosis.
Inclusion criteria for the normal group were; no history of an ankle injury, no surgery, no infection or chronic disease. Exclusion criteria include a history of Achilles tears or major ankle trauma. For patients group, the inclusion criteria were chronic tendinopathy and mid-portion tendinosis of the Achilles tendon. The exclusion criteria were peritendinitis, rupture and traumatic Achilles pathology. The general exclusion criteria for normal and patient group were claustrophobe subjects and pregnant women.
The clinical and ultrasound assessment were performed by a musculoskeletal radiologist with 20 years of experience in musculoskeletal ultrasound. Ultrasound was performed in longitudinal and transverse orientation using color Doppler mode.
2.2. MR Examination and Pulse Sequences
MR examination was performed using a 3 Tesla scanner (Magnetom Verio, Siemens Erlangen, Germany) equipped with a 12 channel head coil. Subjects were positioned in the isocenter of the magnet, feet-first, supine position and both feet in flexion position but only one foot was placed in the coil. Patients were asked to stop all hard physical activities for 24 hours before the MR examination; also they stayed on rest a period of 20 minutes before MR imaging.
|
Sequences Parameters |
2D TSE PD FAT-SAT a | 2D TSE PD FAT-SAT b | 3D VFA-GE UTEc | 2D MESEd |
|---|---|---|---|---|
| Acquisition plan | Sagittal | axial | Sagittal | Sagittal |
| Repetition time (ms) | 3000 | 3860 | 11 | 1500 |
| Echo time (ms) | 27 | 34 | 1.45 | 8.1, 16.2, 24.3, 32.4, 40.5 |
| Flip angle (°) | 147 | 150 | 5, 40 | 180 |
| Field of view (mm*mm) | 220*220 | 273*330 | 280*280 | 280*280 |
| Bandwidth (Hz /pixel) | 246 | 250 | 425 | 250 |
| Matrix | 384*326 | 191*256 | 410*512 | 205*256 |
| Resolution | 384*384 | 212*256 | 512*512 | 256*256 |
| Slice thickness (mm) | 3 | 3.5 | 1.19 | 3 |
| Acquisition time (min: sec) | 3:03 | 2:31 | 3:10 | 2.5 |

The morphological MR protocol of AT includes sagittal Turbo Spin Echo Protons Density Fat-Sat sequence (TSE PD FS) and axial TSE PD FS sequence. For quantification of relaxation times, we used a sagittal 3D FLASH variable flip angle gradient echo UTE sequence (3D VFA-GE UTE) for T1 mapping and a sagittal Multi Echo Spin Echo sequence (MESE) for T2 mapping. Table 1 shows the scanning parameters.
2.3. Data Analysis
Morphological evaluation of tendons was performed on sagittal and axial TSE PD FS images by a radiologist expert in musculoskeletal MRI (20 years of experience) to classify AT diseases and to confirm the inclusion and exclusion criteria for all the subjects. The evaluation was done using Siemens's workstation with syngo software.
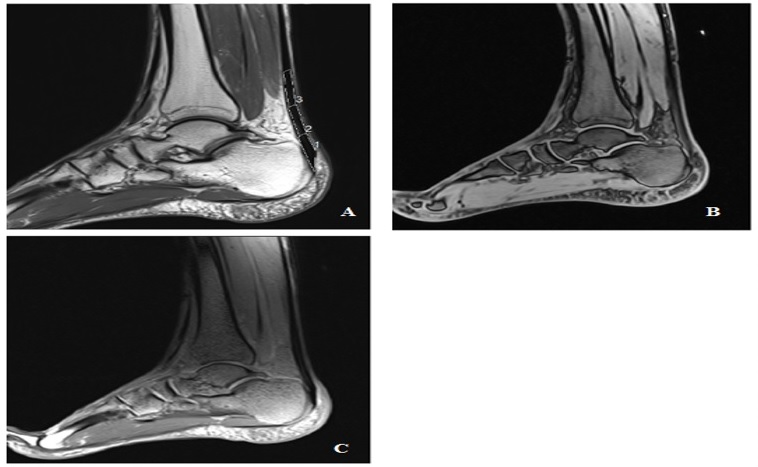
T1 and T2 values were measured with respect to three Regions Of Interest (ROI) (Insertion Tendon (INS), Mid-Portion (MID), and Musculotendinous Junction (MJT)) drawn within each AT (Fig. 1). The length of each region is defined as a third of the total AT length, measured from the most proximal to the most distal [4].
T1 and T2 relaxation times values were quantified using two self-developed algorithms written in MATLAB (MATLAB 2014). The analysis algorithm is executed offline on sagittal images obtained with our quantitative T1 and T2 protocol. T1 and T2 maps were calculated on a voxel-by-voxel basis.
2.3.1. T1 Calculation
T1 values are estimated by a linear regression analysis from images acquired with 3D VFA-GE UTE according to the common Ernst equation for gradient-echo sequences:
 |
(1) |
Where T1 is the longitudinal relaxation time, TR is the repetition Time, M0 is the initial magnetization at t=0 and
We noted  and A=
 |
(2) |
Equation 2 can be readjusted into a linear regression (eq. 3):
 |
(3) |
A and Z can be determined from the linear relationship between  We traced the curve based on the measurements as
  T1 values were calculated from the slope of the curve using the equation 4:
 |
(4) |
2.3.2. T2 Calculation
T2 values are estimated by a monoexponential curve analysis from images acquired with MESE sequence according to the equation:
 |
(5) |
Where
 |
(6) |
Where S refers to the
 |
(7) |
Where A is the signal intensity at t= 0 ms, B refers to T2 and C is the offset.
2.4. Statistical Analysis
A paired sample T-test was realized to calculate the mean and SD of T1 and T2 relaxation times values and to compare the difference between the groups. Person correlation analysis was performed to compare T1 and T2 values of AT for the normal and patients group. The correlation coefficient r indicates a very strong correlation (r = 0.80 to 1.00), a strong correlation (r =0.60 to 0.79), a moderate correlation (r = 0.40 to 0.59), a weak correlation (r = 0.20 to 0.39) or no correlation (r<0.20). We drew T1 and T2 curves and performed linear regression on each of these plots. The slope of each regression line was used as an indicator of the dynamic range for each parameter. Then, we calculated the coefficient of determination (R2) where R2 equal to 1 indicates a very high correlation. Statistical evaluation was performed with SPSS 15.0 (SPSS, Chicago, Illinois, USA). P-value of less than 0.05 was considered to be statistically significant.
3. RESULTS
The results of T1 and T2 imaging of the Achilles tendon of all 48 subjects were analyzed according to the normal and patient group. Axial and sagittal morphological images, T1 and T2 images of the AT are shown in Fig. (1).
T1 and T2 mean values in each ROI of the AT for normal and patients group are summarized in Table 2. Our results show a statistically significant difference in T1 and T2 values in the normal group compared to the patient group (p<0.05). Means values of T1 and T2 in the whole AT were 571.69 ms and 24.16 ms for the normal group and 818.10 ms and 32.43 ms for the patient group. There were no significant differences in T1 and T2 values between the different regions of interest (p>0.05) for the normal group. Whereas, there was a significant difference in the patient group.
The analysis of the variation in T1 and T2 values between the normal and patient group showed no correlation for T1 (r=0.193). Whereas, T2 revealed a positive significant moderate correlation (r=0.542, p=0.000).
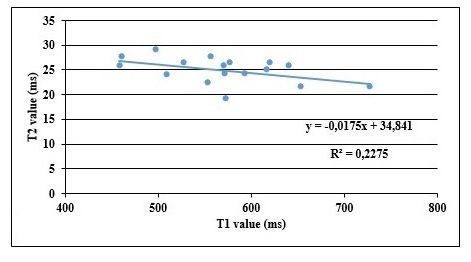
For the normal group, there was no correlation between T1 and T2 (r= 0.091, p=0.489). The plot of T1 and T2 shows a slope equal to 0.0175 with a coefficient of determination R2 equal to 0.22. (Fig. 2).
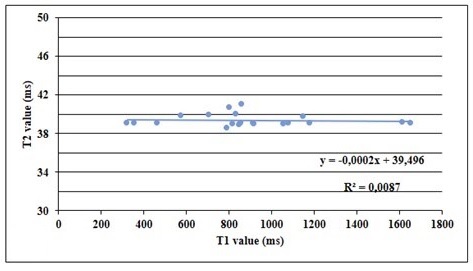
For the patient group, Person’s correlation analysis showed a positive weak correlation between T1 and T2 (r=0.263, p=0.048). The plot of T1 and T2 shows a slope equal to - 0.002 (R2 = 0.0087) (Fig. 3).
| - | T1 value (ms) | T2 value (ms) | ||
|---|---|---|---|---|
| Volunteers | Patients | Volunteers | Patients | |
| IN a | 573,51 | 798.55±404.03 | 24,86 | 35.33±11.11 |
| MID b | 571,63 | 792.53±401.43 | 23,25 | 35.33±11.11 |
| MTJ c | 569,92 | 787.29±397.43 | 24,36 | 35.05±12.35 |
SD = standard deviation; TST = tuberculin skin test.


4. DISCUSSION
T1 and T2 mapping techniques have been used to analyze significant changes in the structural integrity of tendon [5-15]. In this work, Achilles tendon of the same subjects was imaged using the two quantitative MRI techniques (T1 and T2 mappings), and results of the patient group were compared with those of the normal group to define the ability of these techniques for the diagnosis of AT tendinosis.
Our study results indicate significant differences in T1 and T2 mean values between the normal and patient group. These differences may reflect degeneration within the matrix of the tendon. The variation in T1 and T2 values between the normal and patient group, indicated no correlation for T1 and a positive significant moderate correlation for T2. The correlation analysis of T1 and T2 revealed no correlation for the normal group and a positive significant weak correlation for the patient group.
Ulrich Grosse et al. have found T1 of 658.4 ms ± 21.8% for asymptomatic non-tendinopathic tendon and 856.1 ms ± 28.4% for symptomatic tendons using 3D-FLASH Ultrashort Echo time (UTE) sequence with variation of the flip angle at 3 Tesla [16]. Juras and Apprich investigating the feasibility of T2 mapping, have reported that the mean T2 in INS, MID and MTJ were 21.50 ms, 13.13 ms and 14.36 ms respectively [6].
For T1 mapping, our results showed an increase in T1 values as the degenerative change increased in the Achilles tendon of the patient group. Wright et al., studied patient with spondylarthritis at the Achilles tendon, and indicated that T1 mapping has the potential to identify tendon abnormality earlier in comparison to conventional MR sequences by maximizing the sensitivity to subtle changes in the tendon structure [17].
In this study, T2 relaxation times values showed a moderate correlation between the normal and patient group. Edmund Ganal et al., evaluated the efficacy of T2 mapping in detecting differences in the Supraspinatus Tendon (SST) and concluded that T2 mapping is an accurate non-invasive method to identify quantitatively early rotator cuff pathology and the tear group exhibited significantly higher mean T2 values than the tendinosis and asymptomatic groups [10].
Analysis of T1 and T2 revealed no correlation for the normal group and a positive significant weak correlation for the patient group. This difference in results can be explained by the differences in scanning parameters and tissue type.
T1 and T2 values in AT suggested a significant variation between the three anatomical Regions Of Interest (ROI). The regional variation in T1 and T2 values is very clear for the patient group compared to the normal group. The difference in our results and previous published studies can be explained by the differences in scanning parameters, MRI exam conditions and population cohort. Moreover, the results can be influenced by several factors including the magnetic field strength of the MR system, the fitting algorithms and the un-voided experimental noises.
The movement of protons in Achilles tendon is reliant on the orientation of the collagen fibers. When the collagen fibers are oriented 55° to the B0, dipolar interactions reduce and T2 is increased, the so-named the magic angle effect [18, 19]. Henkel man et al. report that the mean T2 of in vitro dog Achilles tendon increases from 7 to 23 ms when the orientation is changed from 0° to 55° [19]. Generally, the magic angle effect is interpreted as an artifact and results in an increased signal intensity in Achilles tendon on sequences with low TE such as T1-, PD- and GRE sequences [20]. In our study, the magic angle effect is minimized since we compared the same region in all the subjects. The UTE sequences are specifically sensitive to the magic angle effect because of the short TE [21]. Therefore, it is essential that the Achilles tendon is placed parallel to the magnetic field when using UTE sequences. This problem is minimized in our study since we positioned all the subjects in supine position and both feet in flexion position parallel to the axis of the table.
Our study is exposed to some limitations. First, the number of subjects is small. Second, the population is heterogeneous and not matched for age, BMC and gender which limits the accuracy of the analysis of the results. Third, this study needs more histological information. Further studies with a larger patient group with histologic correlation are helpful for the evaluation of the reliability of quantitative MR techniques in the early diagnosis of mechanical Achilles pathologies.
CONCLUSION
We concluded that T1 and T2 relaxation times are relatively sensitive to degenerative changes in the AT and T1 and T2 are positively correlated just in the patient group. T1 relaxation time is more sensitive to AT tendinosis compared to T2.
AUTHORS' CONTRIBUTION
Tbini zeineb contributed to the conception of the work, and helped in conducting the study, analyzing the patient data, interpreting the results, and revising the draft. Tbini zeineb also approved the final version of the manuscript, and assisted in drafting and revising the draft, and showed agreement to the conent of the work and was a major contributor in writing of the manuscript.
Mars Mokhtar contributed to the conception of the work, and helped in conducting the study, adjusting MRI exam parameters, interpreting the patient data, revising the draft, approving the final version of the manuscript, and gave agreement to the content of the work.
Mouna Chelli Bouaziz performed the classification of patients and controlled the MRI exam, and also helped in revising the draft, approving the final version of the manuscript. He also showed agreement to the content of the work.
ETHICS APPROVAL AND CONSENT TO PARTICIPATE
The study was approved by Ethics Committee of Kassab Orthopedic Institute, Tunis El Minar University, Tunisia with approval number : CE-IMKO 2015/105.
HUMAN AND ANIMAL RIGHTS
No animals were used in this research. All human research procedures followed were in accordance with the ethical standards of the committee responsible for human experimentation (institutional and national), and with the Helsinki Declaration of 1975, as revised in 2013.
CONSENT FOR PUBLICATION
Verbal and written informed consent was obtained from each patient.
AVAILABILITY OF DATA AND MATERIALS
Not applicable
FUNDING
None.
CONFLICT OF INTEREST
The authors declare no conflict of interest, financial or otherwise.
ACKNOWLEDGEMENTS
Declared none.


