All published articles of this journal are available on ScienceDirect.

Guideline Adherence and the Factors Associated with Better Care for Type 2 Diabetes Mellitus Patients in Lithuanian PHC: Diabetes Mellitus Guideline Adherence in Lithuania PHC
Abstract
Background:
Type 2 diabetes mellitus is one of the most common chronic conditions, which requires appropriate management and care at PHC level, which is described in guidelines. However, guideline adherence at the international arena is insufficient and little is known about the reasons for guideline non-adherence.
Objective:
The aim of the survey was to analyse to what extent the Lithuanian family practitioners adhere to diabetes guidelines in order to compare to international data and to discover the factors associated with better diabetes care.
Methods:
The present study is a part of EUPRIMECARE Project, which sets out to develop a framework aiming at the analysis of PHC across Europe. The sample strategy was based on an unequal probability sampling design. An audit of 4 public and 6 private PHC medical records of the year 2011 was carried out in Kaunas region, clinical records of 382 diabetes type 2 patients were reviewed. Demography, diseases and diabetes performance indicators data were collected using a uniform template. Binary and multivariable logistic regression analyses were used in the investigation of the factors related to better diabetes guideline adherence.
Results:
Three guideline adherence levels were identified: high performance (performed in more than 90% cases) - BP measurement and HbA1c exam; good performance (performed in more than 50% cases) - ECG examination and serum creatinine check; insufficient performance (performed in less than 50% of cases) - annual endocrinologist consultation, eye fundus and foot examinations, LDL check and BMI calculation. Insufficient glycaemic control was positive associated with increased endocrinologist consultation and foot exam rates, elevated BP demonstrated the positive effect to creatinine check rate, multimorbidity had positive association to the annual eye, ECG, creatinine check rates; frequent FP attendance showed no positive effect on process indicators. Rural patients have a negative association to foot and ECG exam rates compared to urban patients. In a stepwise logistic regression model, 3 dependent variables had statistically significant impact on overall diabetes care indicator performance: negative - rural location of patients (OR 0.4, 95% CI 0.2-0.8), elevated mean BP (OR 0.6, 95% CI 0.4-0.9); positive - multimorbidity (OR 2.0, 95% CI 1.2-3.4).
Conclusion:
Guideline adherence for T2DM is not optimal in Lithuanian PHC. The best are BP and HbA1c checks. Suboptimal are BMI and LDL annual checks. The situation with these is almost the same as in other European countries. The better guideline adherence has been observed in urban (foot exam, ECG exam), multimorbidity (eye, ECG, creatinine exams), controlled by means of BP patients (serum creatinine test).
1. INTRODUCTION
Diabetes care is a complex process requiring ongoing patient self-management, education and support with multifactorial risk reduction strategies to prevent acute complications and to reduce the risk of long-term complications [1]. Diabetes type 2 (T2DM) is one of the most common chronic conditions at primary health care (PHC) level, which requires good organisation and coordination in PHC practices [2]. Results of the research indicate that good guideline adherence may prevent T2DM complication progression, improve patient quality of life and limit health expenditure [3, 4].
Although clinical guideline adherence theoretically may improve health outcomes [3], this has more theoretical approach as the evidence from empirical studies is mixed [5]. Therefore, it was concluded that up to 2/3 of the guideline recommendations were not adhered despite different specialties, countries and health systems [6]. Some of the barriers were associated with patient factors (expectations, motivation, compliance) as well as with organisation-related factors (high costs for practice, lack of time and logistical support) [6]. Results of the studies carried out demonstrated a range of factors positively associated with higher guideline adherence - practice characteristics, computerisation, nurse employment [7], managed care (centralised organisation, coordination, responsibility and centralised annual assessment) [8], consultation frequency, patient gender and age [9]. Despite some debates on the guideline adherence associated to better patient health outcomes [8, 10] and the correctness of their application for patients with multimorbidity [11], there is a need to follow the guidelines as they are in line with the best available evidence of clinical practice and cost-effectiveness.
For measurement of the diabetes care quality, a wide range of guideline adherence indicators were used. The most often analysed in the research are the following: body mass index (BMI) [12], foot and eye examinations [12, 13], measurement of glycolised haemoglobin (HbA1c), low density lipoprotein (LDL), glomerular filtration rate, urine albumin, assessment of smoking status [5, 9, 14]. There is evidence showing that the achievement of specific goals for each of these indicators leads to better diabetes outcomes, and strong evidence demonstrates that major complications are reduced if these goals are achieved [15]. In Lithuania, a few studies were carried out indicating not optimal diabetes care in the country [16, 17] however, the guideline adherence on diabetes care is not addressed in a systematic way [18].
National guidelines on diabetes care of T2DM patients were firstly published in 2002 [19], then revised in 2005 [20] and later in the year 2012 [21]. The guidelines were based on the annual assessment of patients and on the performance of tests and examinations rather on the decision-making process addressing how to treat the disease. Both the family physician (FP) and endocrinologist are involved in diabetes care, but their roles lack clarity with respect to functions and responsibility in diabetes care. According to the national guidelines, patients with T2DM shall be directed to an endocrinologist once a year, even it is well controlled. For the study period, the targets were the following: HbA1c ≤ 7.0%, blood pressure (BP) <130/80 mmHg; and total cholesterol <4.8 mmol/l.
The aim of the survey was to analyse to what extent the Lithuanian FP adhere to national T2DM guidelines and to assess the relationships between adherence to guidelines and patients and healthcare practice characteristics.
2. METHODS
The present study is a part of EUPRIMECARE Project [22], which sets out to develop a framework aiming to analyse PHC across Europe, to assess and compare PHC models in terms of quality and identification of costs. The article introduces the Lithuanian data on T2DM care.
2.1. Participants
An audit of medical records was carried out in Kaunas region that is the most central geographical location of Lithuania covering both urban and rural areas. Economic indicators (e.g. salaries) in this region are equal to the Lithuanian average. The population of Kaunas region amounts to 453,482 inhabitants making almost 15% of the total population of Lithuania.
In autumn of 2011, 49 Primary health care centres providing PHC services for the population under the contract with Sickness Funds were operating in Kaunas region. According to the Sickness Funds data, the majority of population was served in urban (85.8% vs.15.2% rural), public (60.1% vs. 39.9% private) and large (47.3% vs. 37.7% medium and 15.0% small) PHC centres (large PHC served 20,000 and more patients, medium PHC centres served 5,000 to 19,999 patients and small PHC centres served less than 5,000 patients).
The sample strategy was based on a πPS unequal probability sampling design [23] that deals with complex distribution of sampling units: size of PHC institution (large, medium, small practices), urbanisation (rural or urban), different ownership (public or private). 4 public and 6 private PHC centres were selected. As in one small urban and one medium urban centre the necessary number of patients with T2DM was not available, two additional centres (which represented the same size and urbanization) were included in the study.
Data were collected after the permission by the Ethics Committee of the Lithuanian University of Health Sciences was received in March 2012. The heads of the selected PHC centres were informed about the survey aims and procedure, and notified about the special emphasis that should be made on personal data protection during data collection - only gender and date of birth of patients should be included into the study and no information related to physicians would be collected. All heads of PHC centres signed written agreements on participation provided that they would receive the report from the research team about the performance of a particular PHC centre.
At the time of research, majority of Lithuania FP used ambulatory cards in paper form. Each FP provided the list of their patients with T2DM. Patients of all family practitioners working for the same PHC centre were merged and from this the required number of patients was selected for the audit randomly. Three trained medical staff members collected data from individual medical records (paper form) at each PHC centre.
Medical records concerning patients with a diagnosis of T2DM (E11.0 – E11.9 according to the ICD-10 classification) in the year 2011 were included. The relevant clinical data were recorded using a uniform template. Records of demography data (gender, age, residence area), medicine data (all patient diseases, medicines, reasons and number of consultations to specialists, FPs, diabetes indicator examination data (eye fundus exam, foot check, BP, ECG), laboratory data (HbA1c, serum creatinine, LDL concentration) were made. If several of the same kind checks during the year 2011 were done, they were counted separately.
2.2. Measures
The following nine good diabetes patient care indicators were analysed that should be checked or should perform in compliance with the national diabetes care protocol [20]: 1. BMI exam 2. Foot examination (for diabetic polyneuropathy and arterial blood circulation) 3. Eye fundus examination 4. ECG exam 5. HbA1c exam 6. Low-density lipoprotein (LDL) concentration 7. Serum creatinine concentration 8. Endocrinologist consultation 9. BP measurement. All the measures should be performed at least once per year, except glycated haemoglobin. According to the diabetes care protocol, glycated haemoglobin should be done 4 times per year. As logistic independent variable we set criterion – at least 2 times per year to compare to other countries. The place where the checks were performed, i.e. at PHC or at the secondary health care level (endocrinologist consultation or hospital), was not considered. An obligatory annual endocrinologist consultation was included into analysis as the Lithuanian diabetes care protocol [20] requires for it. Microalbuminuria, protein in 24 hours urine, albumin/creatinine ratio tests were not included in the further analysis as there were no possibilities to do these tests in Lithuania at PHC level in the year 2011. BP measurement was included in the study as mean systolic and diastolic blood pressure values during the year 2011.
2.3. Definitions
Variables selected for the study were the following: I. Demographic characteristics of patients: 1. gender (male or female) 2. age (under 65 years or 65 years and older) 3. place of residence (rural or urban location). II. Variables reflecting the patient’s health status: 1. high BP (mean blood pressure >=130/80 mmHg vs <130/80 mmHg) 2. insufficient glycaemic control (HbA1c ≥7%, vs HbA1c <7%) 3. multimorbidity (number of diagnoses ≤2 vs >2) 4. polypharmacy (number of medicines taken ≥5 vs. less than 5). III. Variables related to the frequency: 1. frequent GP attender (13 or more GP consultations per year vs less than 13 consultations) 2. HbA1c making frequency (>2 times per year vs ≤2. Frequent GP attender was named according to literature data [24], multimorbidity and polypharmacy was set according to literature data [25]. Finally count of all ‘must done’ according to diabetic care protocol measures and procedures (9 indicators: HbA1c measurement >2 times a year; blood pressure measuring, ECG examination, serum creatinine, endocrinologist consultation, eye fundus examination, leg examination for pulse and neuropathy, LDL, BMI - at least one time a year) were split into two groups according to the dataset median preparing them to logistic regression (better guideline adherence, ≥5 procedures vs poor, < 5 measures done).
2.4. Statistical Analysis
Descriptive statistics of patients was generated. Characteristics of the population are presented as means, standard deviations or proportions according to a diabetes care group. Finally, we carried out univariate and stepwise multivariate logistic regression analysis and calculated odds ratios in order to verify the differences between the reference group and each of other variables setting the statistical significant level at 0.05. Logistic regression method was chosen as it requires no linear relationship between dependent variables and does not need residuals normal distributed, also it deals good with a binary ordinal dependent variables. The variables were checked by means of collinearity and significant collinear variables were dropped out from calculations.
All the analyses were carried out on IBM SPSS (software package for statistical analysis) Statistics Package Ver. 21.0 (IBM Corp. Released 2012. IBM SPSS Statistics for Windows, Version 21.0. Armonk, NY: IBM Corp.).
3. RESULTS
382 patient records were reviewed retrospectively. The study population contained statistically significant more female patients (Table 1). The average patient age was 66.2±10.4 years, whereas 60.5% of persons were above 65 years old. Majority of patients lived in urban area (84.8%). The mean glycated haemoglobin of the entire study population was 7.3±1.2%. Proportions of patients with the mean glycated haemoglobin above 7% and less than 7% were approximately the same (47.4 and 43.2% respectively). Polypharmacy was found in 34.3% of study patients. Most of the patients have more than 2 diagnoses, included T2DM (83.2%).
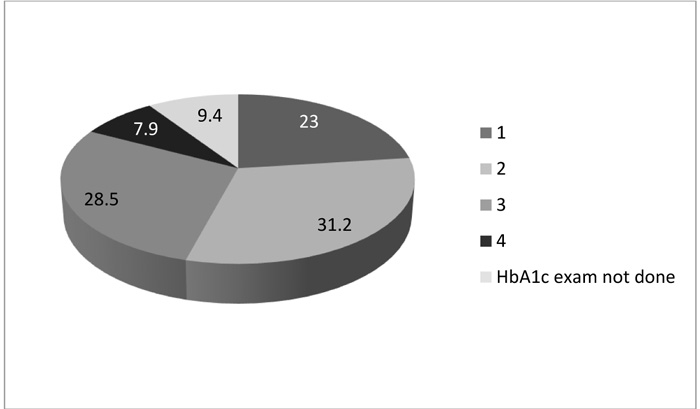
Performance of T2DM indicators varied from 19.4% (BMI calculation) to 100% (BP measurement) (Table 2). The following three performance levels could be identified: high performance (performed in more than 90% cases) - BP measurement and HbA1c exam; good performance (performed in more than 50% cases) - ECG examination and serum creatinine check; and insufficient performance (performed in less than 50% of cases) - annual endocrinologist consultation, eye fundus and foot examinations, LDL check and BMI calculation. Fig. (1) illustrates the HbA1c measurement frequency during the 12 months study period. HbA1c was measured 2 times per year for 54.2% and 4 times (per diabetic care protocol) only in 7.9% of patients respectively, so HbA1c checks are considered to be done not as often as required per diabetes protocol.
| - | Number | % | p |
|---|---|---|---|
| Gender: | |||
| Male | 150 | 39.3 | 0.001 |
| Female | 232 | 60.7 | |
| Age (years) | |||
| <65 | 151 | 39.5 | 0.001 |
| >=65 | 231 | 60.5 | |
| Residence area | |||
| Rural | 58 | 15.2 | 0.001 |
| Urban | 324 | 84.8 | |
| HbA1c (%) | |||
| < 7 | 165 | 43.2 | 0.39 |
| >=7 | 181 | 47.4 | |
| Glycaemic status unknown/not done | 36 | 9.4 | |
| Polypharmacy | |||
| <5 medicines | 250 | 65.4 | 0.001 |
| >=5 medicines | 131 | 34.3 | |
| Number of diagnoses | |||
| ≤2 | 64 | 16.8 | 0.001 |
| >2 | 318 | 83.2 |
| Investigation done | n | % |
| Arterial blood pressure | 382 | 100.0 |
| HbA1c | 347 | 90.6 |
| ECG | 253 | 66.2 |
| Serum creatinine | 204 | 53.4 |
| Endocrinologist consultation | 189 | 49.5 |
| Eye examination | 177 | 46.3 |
| Foot examination | 165 | 43.2 |
| LDL | 91 | 23.8 |
| BMI | 74 | 19.4 |
| Dependent factors | Independent factors** | ||||||||
| BMI | Foot exam | Eye exam | ECG exam | HbA1c making frequency*** | LDL | Serum creatinine | Endocrinologist consultation | ||
| Gender | Male | 1.0 (ref) | |||||||
| Female | 1.0 (0.6-1.6 | 1.3 (0.8-2.2) | 1.6 (1.1-2.4)* | 0.9 (0.6-1.5) | 1.4 (0.9-2.1) | 1.3 (0.7-2.2) | 1.0 (0.7-1.6) | 0.6 (0.4-1.0) | |
| Patient age (years) | <65 | 1.0 (ref) | |||||||
| ≥65 | 0.4 (0.2-0.7 | 1.1 (0.6-1.9) | 1.5 (1.1-2.4)* | 2.1 (1.3-3.5)* | 1.3 (0.8-2.1) | 0.2 (0.1-0.3)*** | 1.7 (1.1-2.7)* | 0.7 (0.4-1.1) | |
| Patient location | Urban | 1 (ref.) | |||||||
| Rural | 0.9 (0.4-1.8) | 0.3 (0.1-0.7)** | 0.5 (0.3-0.9) | 0.3 (0.2-0.5)*** | 0.5 (0.3-0.9)* | 1.2 (0.6-2.5) | 0.8 (0.5-1.5) | 1.1 (0.6-1.8) | |
| Mean blood pressure per year | <130/80 | 1 (ref) | |||||||
| ≥130/80 | 1.4 (0.6-3.2) | 1.5 (0.6-3.6) | 1.6 (0.9-3.1) | 2.8 (1.5-5.3) | 1.5 (0.8-2.9) | 1.3 (0.5-3.4) | 2.4 (1.3-4.5)** | 1.7 (0.9-3.2) | |
| Mean HbA1C per year | <7 | 1 (ref.) | |||||||
| ≥7 | 0.5 (0.3-1.0) | 2.1 (1.2-3.6)** | 0.8 (0.5-1.3) | 1.0 (0.6-1.7 | 0.5 (0.4-0.9)* | 1.3 (0.7-2.3) | 0.7 (0.5-1.2) | 2.0 (1.2-3.1)** | |
| Number of diagnoses (diabetes included) | ≤2 | 1 (ref.) | |||||||
| >2 | 1.1 (0.5-2.1) | 0.9 (0.4-2.0) | 2.2 (1.3-3.8)** | 2.8 (1.6-5.1)*** | 1.3 (0.8-2.3) | 0.5 (0.3-1.1) | 2.3 (1.3-3.9)** | 1.3 (0.8-2.3) | |
| Frequent FP attender (visit number per year) | <13 | ||||||||
| ≥13 | 0.6 (0.3-1.0) | 0.6 (0.4-1.1) | 0.7 (0.5-1.2) | 0.6 (0.4-0.9)* | 0.7 (0.4-1.1) | 1.3 (0.7-2.3) | 0.8 (0.5-1.2) | 1.2 (0.8-1.9) | |
**checks and tests were done at least once per year.
***HbA1c checks were done ≤2 times per year vs >2 times.
A logistic regression model revealed the relationship between a range of dependent variables and the performance of indicators (Table 3). Insufficient glycaemic control (HbA1c≥7%) was positive associated with increased endocrinologist consultation and foot exam rates (OR 2.0, 95% CI 1.2-3.1 and OR 2.1 95% CI 1.2-3.6 respectively) but also on the poorer HbA1c measure frequency (OR 0.5, 95% CI 0.4-0.9); multimorbidity had positive association to the annual check of eye exam (OR 2.2, 95% CI 1.3-3.8), ECG (OR 2.8, 95% CI 1.6-5.1), creatinine (OR 2.3, 95% CI 1.3-3.9) rates; frequent FP attendance showed no positive effect on process indicators, but had inverse association to ECG indicator rate (OR 0.6, 95% CI 0.4-0.9). Elevated mean BP had a positive association to creatinine test rate (OR 2.4, 95 CI% 1.3-4.5). Patient demographic factor analysis revealed older patient age (≥65 years age) had positive association on eye exam (OR 1.5 95% CI 1.1-2.4), ECG (OR 2.1 95% CI 1.3-3.5), serum creatinine (OR 1.7, 95% CI 1.1-2.7), but negative to LDL (OR 0.2, 95% CI 0.1-0.3) to be checked. Rural patients have a negative association to foot exam and ECG exam rates (OR 0.3, 95% CI 0.1-0.7 and OR 0.3 95% CI 0.2-0.5 respectively) compared to urban patients.
In order to identify the variables having a statistically significant impact on the performance of indicators, univariate and multivariate stepwise regression models were applied (Table 4). The results of the study demonstrated that rural location of patients (OR 0.5, 95% CI 0.3-0.8) and elevated mean blood pressure (OR 0.8, 95% CI 0.6-0.9) have a negative impact on the performance of these indicators. In stepwise logistic regression model, 3 dependent variables had statistically significant impact on performance: negative - rural location of patients (OR 0.4, 95% CI 0.2-0.8), elevated mean BP (OR 0.6, 95% CI 0.4-0.9); positive - multimorbidity (OR 2.0, 95% CI 1.2-3.4).
4. DISCUSSION
Although some efforts to investigate the performance of diabetes care in Lithuania were observed [16], the present study is among the first ones aiming at assessment of the adherence to diabetes guidelines and at the identification of the predicting factors for greater adherence.
The findings have demonstrated a dramatic discrepancy between the performance level of different indicators ranging from 19.4% (BMI calculation) to 100% (BP measurement). Although the performance of some indicators could be related to financial (dis)interest (for HbA1c exam, GP practices get financial incentives up to 4 times per year, performance level of 90.6%; annual LDL check is not covered by national insurance, patients have to pay for the test, performance level of 23.8%), a rather great scatter of adherence to other recommended indicators forces to search for the explanations going beyond the financial issues. The results of the study carried out in Cameroon [26] demonstrate that around 1/3 of physicians (36.4%) complete the full physical examination during the consultation of a diabetes patient. Our findings emphasise the need to take into account the importance of psychosocial, behavioural and managerial aspects while addressing the issue of guideline adherence. A large body of evidence demonstrates that T2DM care is not optimal even in the countries with a strong PHC based on teamwork and family physicians acting independently from specialists [5, 27]. The performance level revealed by our study is 46.3% for eye examination and 43.2% for foot examination. Results similar to the outcomes of our study have been found by the studies carried out in the Netherlands [5] and Sweden [28] indicating that adherence was below 50% for foot and eye examinations, and was high (≥85%) for BP and HbA1c. However, the striking differences between Lithuania and other countries in the performance of annual assessment of BMI (19.4% in our study and 70% in the Dutch study) [5] suggest the low primary care team awareness of the importance of the increased body mass in diabetes care or/and non-efficient teamwork [28]. The guideline adherence is very likely to be linked to the interplay of a great spectrum of individual, practice and policy-related factors, whereas a better understanding of the complexity of the phenomenon could be a tool for enhancing the adherence to diabetes care guidelines in PHC of both Lithuania and other countries [29].
| Predictor | Description | Univariate regression model** | Stepwise multivariate regression model*** | ||||||
|---|---|---|---|---|---|---|---|---|---|
| OR | 95% CI | p | OR | 95% CI | p | ||||
| Lower | Upper | Lower | Upper | ||||||
| Gender | Male | 1 (ref.) | |||||||
| Female | 0.9 | 0.7 | 1.1 | 0.32 | - | ||||
| Patient age (years) | <65 | 1 (ref.) | |||||||
| ≥65 | 0.8 | 0.6 | 1.0 | 0.12 | - | ||||
| Patients location | Urban | 1 (ref.) | |||||||
| Rural | 0.5 | 0.3 | 0.8 | 0.01 | 0.4 | 0.2 | 0.8 | 0.01 | |
| Mean blood pressure per year | <130/80 | 1 (ref.) | |||||||
| ≥130/80 | 0.8 | 0.6 | 0.9 | 0.02 | 0.6 | 0.4 | 0.9 | 0.04 | |
| HbA1C, % | < 7 | 1 (ref.) | |||||||
| >=7 | 1.1 | 0.8 | 1.5 | 0.54 | - | ||||
| Number of diagnoses (diabetes included) | ≤2 | 1 (ref.) | |||||||
| >2 | 0.9 | 0.7 | 1.1 | 0.39 | 2.0 | 1.2 | 3.4 | 0.01 | |
| Number of medicines | <5 | 1 (ref.) | |||||||
| >=5 | 0.8 | 0.6 | 1.1 | 0.17 | - | ||||
**data from separate logistic regressions.
***only significant variables were included into final model Significant relationships are provided in bold.
Our data illustrate that the rural location of patients and not controlled BP are associated with the lack of adherence to a diabetes protocol (foot, ECG exams and creatinine test respectively). Although the data concerning the impact of rural and urban differences in the guideline adherence is controversial: the results of the study carried out in the USA have demonstrated that foot and eye examination were lower in rural areas [30], the results of the Finnish study have revealed neither rural nor urban differences by means of treatment targets of diabetes (HbA1c) [31], a distance from health care centres has been found by the Australian study [32] as a factor associated with better guideline adherence. In our study, treatment target HbA1c performance once a year is rather good, but it is far from recommended as the optimum 4 times per year; in logistic regression, we see poorer glycaemic control is associated with rare HbA1c checks.
On the other side, in our study multimorbidity increased adherence to T2DM guidelines (eye, ECG, creatinine exams). In the case of multimorbidity, indicator performance is known to depend on whether the conditions are strongly associated with each other or not; it was found out that patients with a strongly related to T2DM condition - cardiovascular disease - were more likely to have their BP measured [9].
In our study, frequent FP attendance has no positive impact on guideline adherence. Frequent patient attendance has been found positively associated with better guideline adherence by the studies carried out in Australia [32], Saudi Arabia [33]. The relationship between the higher performance and frequent attendance raises doubts about the efficiency of a diabetes patient management pattern. Increasing the chance of the performance of a larger set of indicators, frequent attendance increases respectively the turnover of diabetes patients thereby reducing the time allocated to a consultation and, potentially, to its efficiency. The aforesaid findings encourage the insight that in order to increase the adherence to diabetes care guidelines both the educational gaps in the knowledge of physicians and the decision-making process related to diabetes should be addressed [34]. Results of other studies illustrating the guideline adherence are positively associated with group practice and practice computerisation [7], managed care (characterised by centralised organisation, coordination, responsibility and centralised annual assessment) [8], nurse employing practices [7], and support the idea that wider strategies are required to improve the diabetes care including the greater integration of community nurses [35, 36], allocation of higher responsibility to family physicians (up to 2012 GPs were not allowed to manage diabetes patients themselves [19-21], e-health solutions [37].
Our study suggests that the adherence to diabetes care guidelines in Lithuania is challenging similarly to other countries. The results of other studies also illustrate that there is no significant difference in diabetes care of Eastern and Western Europe [38]. As it becomes more evident that different health systems face similar difficulties, an increasing demand to find out the generalisable solutions of these problems is observed. In the future research, the transferability of the aforesaid solutions should be assessed.
5. LIMITATIONS OF THE SURVEY
The present study has certain limitations. Firstly, the medical records of the patients have been reviewed only at primary care level (there is a possibility that the BMI, foot examination or eye fundus examination have been provided in secondary care settings) and this could impair the picture of overall T2DM care of the country. Secondly, the study has a cross-sectional design that allows no analysis of causal inference. Thirdly, there was possibility an FP writes down not everything he does. Thus, the national adherence to diabetes guidelines might be higher.
CONCLUSION
Guideline adherence for T2DM is not optimal in Lithuanian PHC. The best are BP and HbA1c checks. Suboptimal are BMI and LDL annual checks. The situation with these is almost the same as in other European countries. The better guideline adherence has been observed in urban (foot exam, ECG exam), multimorbidity (eye, ECG, creatinine exams), controlled by means of BP patients (serum creatinine test).
ETHICS APPROVAL AND CONSENT TO PARTICIPATE
Permission by the Ethics Committee of the Lithuanian University of Health Sciences was received in March 2012
HUMAN AND ANIMAL RIGHTS
No animals/humans were used for studies that are the basis of this research.
CONSENT FOR PUBLICATION
All heads of PHC centres signed written agreements on participation provided that they would receive the report from the research team about the performance of a particular PHC centre.
AVAILABILITY OF DATA AND MATERIALS
Not applicable.
FUNDING
None.
CONFLICT OF INTEREST
The authors declare no conflict of interest, financial or otherwise.
ACKNOWLEDGEMENTS
Declared none.