All published articles of this journal are available on ScienceDirect.

T2 Versus T2* MRI Mapping in the Knee Articular Cartilage at 1.5 Tesla and 3 Tesla
Authors Info & Affiliations
Abstract
Background:
Recently, several studies have shown that T2 and T2* MRI parametric mapping are sensitive to structural and biochemical changes in the extracellular cartilage matrix. The objective of this study was to assess, compare and correlate quantitative T2 and T2* relaxation time of the knee articular cartilage at 1.5 Tesla (T) and 3 Tesla.
Methods:
Thirty-eight symptomatic patients with knee articular cartilage disease and forty-one asymptomatic volunteers were prospectively included in the study. Knee MRI examination was performed by 3 T and 1.5 T scanner. Multi-Echo Spin-Echo (MESE) and Multi-Echo Gradient Echo (MEGE) sequences were used to determine T2* and T2 maps. T2 and T2* relaxation times values were measured in three Regions Of Itnterest (ROI) on knee articular cartilage using mono-exponential analysis fitting algorithm.
Results:
There was a significant difference between volunteers and patients for T2 and T2* relaxation times values at 1.5 T and 3 T (p<0.05). The comparison between magnetic fields has shown lower T2 and T2* relaxation times at 3 T compared to 1.5 T. Pearson’s correlation analysis between T2 and T2* at 1.5T revealed a significant positive correlation for volunteers (r=0.245, p = 0.01) and a significant negative correlation for patients (0.016, p = 0.018). At 3T, there was a significant positive correlation between T2 and T2* for volunteers (r=0.076) and patients (r=0.165). The correlation of T2 and T2* between 1.5 T and 3T showed a significant negative correlation (r=-0.087, p = 0.01).
Conclusion:
T2* mapping may be used for the diagnosis of knee articular cartilage osteoarthritis with the advantage of relatively short scanning time, higher SNR, shorter echo times and the non-effect of the stimulated echo compared to T2 mapping.
1. BACKGROUND
Cartilage is composed of chondrocytes surrounded by the extracellular matrix, which consists primarily of water, proteoglycans and collagen fibres [1]. It is one of the most important structures involved in a degenerative joint disease like Osteoarthritis (OA) [2]. Magnetic Resonance Imaging (MRI) is the imaging modality of choice for the diagnostic of the knee articular cartilage defect. Conventional MRI sequence can detect morphologic changes which normally occur in an advanced stage of OA whereas T2 and T2* mapping is sensitive to structural and biochemical changes in the extracellular cartilage matrix. Both T2 and T2* can detect biochemical changes in the cartilage which occurs in the early stage of OA like the change of collagen orientation, the collagen content and tissue hydration [3, 4].
T2 mapping based on Single Echo Spin Echo (SESE) sequence uses a 90° Radio Frequency (RF) pulse to flip the longitudinal magnetization to the transverse plane which is the measurement plane. The spin-spin interaction will create a dephasing and signal decay which is accelerated by magnetic field inhomogeneities. To rephase spins and to cancel the effects of B0 inhomogeneities, we apply a 180° RF pulse. When spins are again in phase, we measure the signal. This timing of signal measurement is called Echo Time (TE). The signal decay follows the exponential equation: SI=S0 *exp (-TE/T2), where S 0 is the apparent proton density. So, to calculate T2 relaxation time, we need to acquire images at different echo times to get the decay curve and then we do a curve fitting to calculate the T2 relaxation time.
T2 mapping provides information about cartilage water content, collagen fiber content and extracellular matrix organization. In normal cartilage, the deepest radial zone of cartilage with a highly organized collagen fiber structure and less water is characterized by short T2 values. T2 values are prolonged in the transitional zone, where fibers have a relatively random orientation, and become shorter again in the deep calcified zone with highly organized collagen fibers because of the little proton mobility [5].
T2 and T2* are related with the following formula (E1):
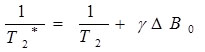 |
Where γ is the gyromagnetic ratio of the observed nucleus and ΔB 0 is the magnetic field inhomogeneity. We notice that T2* is affected by the inhomogeneity of the external magnetic field: Greater inhomogeneity of B 0 will result in shorter T2* values. T2* is more sensitive to microscopic and macroscopic changes in the magnetic field [6, 7]. To calculate T2* mapping, we use a MEGE sequence, which uses magnetic gradients for the rephasing of spins instead of 180° RF pulse used in spin echo. T2* mapping was recently introduced in the description of articular cartilage [8, 9]. It gives additional information compared to the standard T2 mapping with the possibility of high Signal to Noise Ratio (SNR) and high spatial resolution in a relatively short scanning time [10].
T2 mapping uses echo times between 10-80 ms, whereas T2* mapping uses shorter TEs which make T2* more sensitive to short T2 structures and collagen architecture [8]. The use of a very short TEs makes T2* more sensitive to both mildly and severely degenerated cartilage, as compared to T2 values which do not vary until more severe degradation [11]. The shorter echo times available for T2* mapping additionally allow T2* values to be more robust for assessing the deep zone of cartilage [11]. The use of high field systems (3 Tesla) has significantly improved the ability of biochemical imaging to diagnose cartilage disorders at an earlier stage [12].
T2 and T2* relaxations Times were sensitive to alteration or disruption of the Extracellular Matrix (ECM) in the articular cartilage. Recently, quantitative assessment of cartilage disorders using biochemical sensitive MRI techniques presents the best opportunity to diagnose early microscopic degenerative changes of cartilage and follow-up of patients after treatment. The purpose of this study was to assess quantitative T2 and T2* relaxation time of the knee articular cartilage at 1.5 T and 3T, to compare T2 and T2* relaxation time values for the same population at 1.5 T and 3T and to search for correlation between T2 and T2* values at the same magnetic field strength.
2. METHODS
2.1. Population
Thirty-eight symptomatic patients and forty-one asymptomatic volunteers were prospectively included in this study: twenty-seven asymptomatic volunteers (15 males, 12 females, mean age 34.3 ± 9.5 years) and twelve symptomatic patients (1 male, 11 females, mean age 42.6 ±11.30 years) were examined at 1.5 T. Patients were included in this study according to the following criteria: patellar femoral or tibial femoral arthrosis, and internal or external meniscal lesions.
At 3 T, fourteen asymptomatic volunteers (8 males, 6 females, mean age 36.6 ±9.1 years) and twenty-six symptomatic patients (23 males, 3 females, mean age 33.4 ± 13.3 years) with knee patellar femoral arthrosis or internal/external meniscal lesions.
To assess the correlation of T2 and T2* in the two magnetic field strength, ten of the asymptomatic volunteers were examined at both 1.5T and 3T. The non-inclusion criteria for all subject were claustrophobe subjects and pregnant women.
All subjects were well positioned with the joint space in the middle of the coil and the knee in the extension position. Few sequences were excluded due to patient’s movements. To avoid possible differences in T2 relaxation times due to loading/weight bearing of cartilage before the examination, parametric mapping was performed after around half an hour of rest and after the acquisition of the morphological protocol.
2.2. MRI Protocol
MR imaging was performed on 1.5 T scanner (Magnetom Aera, Siemens Erlangen, Germany) equipped with a 15 channels knee coil and on 3T scanner (Magnetom Verio, Siemens Erlangen, Germany) equipped with 8 channels knee coil. For morphological knee articular cartilage assessment, we used three planes (sagittal, coronal, transverse) proton density fat saturation fast spin echo (PD FS FSE) sequences. Quantitative knee articular cartilage protocol includes a MESE sequence and MEGE sequence for T2 and T2* measurement respectively. We have chosen the sagittal plane as acquisition plane because it allows the evaluation of articular cartilage in a direction perpendicular to the majority of the weight forces acting on the joint. The number of slices was chosen equal to 11 with a slice thickness of 3 mm and a gap of 3 mm to cover the two sagittal planes (internal and external). To reduce the chemical shift artefact between water and fat in the cartilage, we have chosen a bandwidth of around 220 Hz / pixel corresponding to a chemical shift of 1 pixel on 1.5 T and 0.5 pixel on 3 T. The details of MRI protocol scanning parameters are listed in Table 1.
| Parameters | 1.5 Tesla | 3 Tesla | ||||
|---|---|---|---|---|---|---|
| Sequences | FSE FS PD |
MESE T2 |
MEGE T2* |
FSE FS PD |
MESE T2 |
MEGE T2* |
| Repetition Time (ms) | 3240 | 1500 | 592 | 3174.1 | 1500 | 592 |
| Echo Number | 1 | 5 | 6 | 1 | 6 | 6 |
| Echo Time (ms) | 38 | 12.5, 25, 37.5, 50, 62.5 | 5.6, 13.9, 20.8, 28.9, 36, 50 | 36 | 12.5, 25, 37.5, 50, 62.5, 75 | 4.7, 12.8, 21, 29.2, 37.4, 50 |
| Number of Slices | 22 | 11 | 11 | 28 | 11 | 11 |
| Slice Thickness | 3 | 3 | 3 | 3 | 3 | 3 |
| Field of View (mm x mm) | 160 x 160 | 160 x 160 | 160 x 160 | 162x199 | 160 x 160 | 160 x 160 |
| Matrix | 320x240 | 192 x 256 | 192 x 256 | 312x384 | 192 x 256 | 192 x 256 |
| Acquisition Time (min:sec) | 1:50 | 2:50 | 2: 03 | 2:58 | 2: 50 | 2:05 |
2.3. Image Analysis
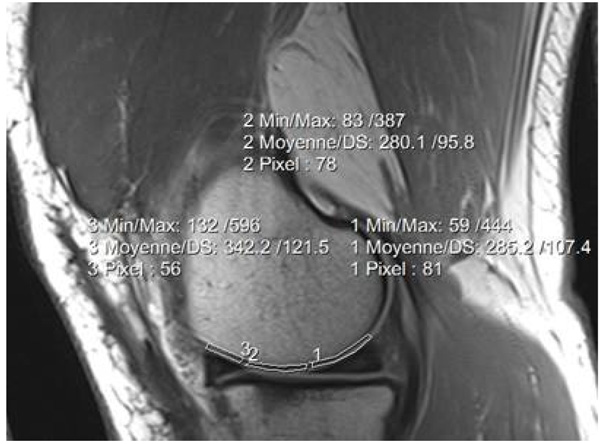
T2 and T2* values were calculated using mono-exponential fitting algorithm. Femoral cartilage was segmented into three regions (ROI’s): Anterior, Medial and Posterior. The inner margin of the meniscus was used as a marker for determining the anterior and posterior borders [13]. A total of six ROIs were drawn in the articular cartilage for each knee (internal and external). We did not include the superficial zone to avoid the chemical shift artefact. A few cases with big movement between scans were excluded. Fig. (1) shows the three regions of interest drawn on the knee articular cartilage.
2.4. Data Analysis
We calculated the mean T2 and T2* values and their Standard Deviations (SD) for both magnetic fields. We compared T2 and T2* values for asymptomatic volunteers and symptomatic patients scanned at 1.5T and we did the same for asymptomatic volunteers and symptomatic patients at 3T. We have drawn T2 and T2* curves and we performed linear regression on each of these plots. The slope of each regression line was used as an indicator of the dynamic range in each sequence. Then, we calculated the coefficient correlation (R2) with R2 equal to 1 indicating very high correlation.
For the asymptomatic volunteers scanned on both systems (1.5T and 3T), we compared the mean T2 and T2* values. Then, we calculated the average differences and the percent of differences. Statistical evaluation was performed with SPSS 15.0 (SPSS, Chicago, Illinois, USA). The Pearson correlation was performed to correlate between T2 and T2*. P values less than 0.05 were considered statistically significant.
3. RESULTS
3.1. Correlation between T2 and T2* at 1.5T
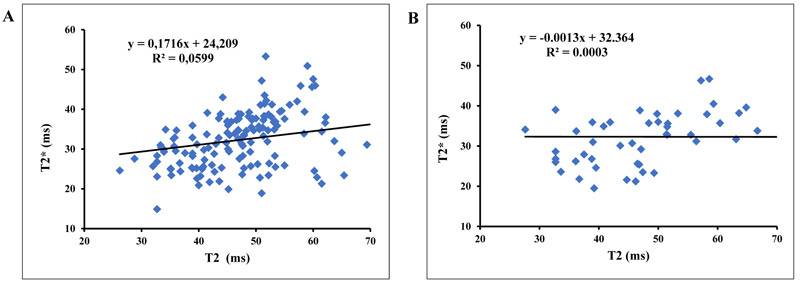
A total of six ROIs were analysed in each knee articular cartilage. At 1.5 T, the mean T2 and T2* relaxation time values for asymptomatic volunteers were 47.6±10 ms for T2 and 32.3±7 ms for T2* and for symptomatic patients, values were 57.4±76.9 ms for T2 and 32.2±6.2 ms for T2*. There was a significant difference between asymptomatic volunteers and symptomatic patients for T2 (p = 0.01) and T2* (p = 0.01). The variation of results between asymp- tomatic volunteers and symptomatic patients is more pronounced in T2 relaxation time than for T2* relaxation time.
Pearson’s correlation analysis between T2 and T2* for asymptomatic volunteers at 1.5 T revealed a positive correlation, which is statistically significant (correlation coefficient =0.245 and p = 0.01). For symptomatic patients, the result showed a negative correlation between T2 and T2*. This correlation is statistically significant (correlation coefficient = -0.016 and p = 0.018).
The plots of T2* and T2 for asymptomatic volunteers have shown a slope equal to 0.0171 with a correlation coefficient R2 equal to 0.059 and a slope equal to -0.0013 with R2 equal to 0.0003 for symptomatic patients (Fig. 2).
3.2. Correlation between T2 and T2* at 3T
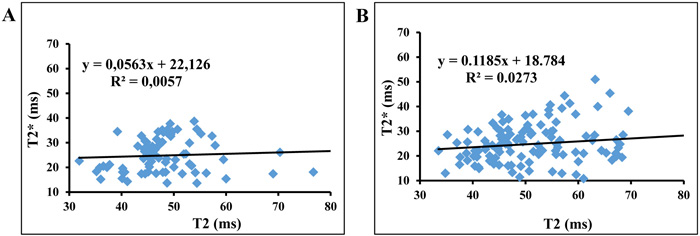
At 3T, mean T2 and T2* relaxation times values were, 48.3±8.8 ms and 24.8±6.6 ms in case of asymptomatic volunteers respectively and 51.1±10.8 ms and 24.8±7.7 in case of symptomatic patients respectively. There was a significant difference between asymptomatic volunteers and symptomatic patients for T2 (p = 0.01) and T2* (p = 0.01). The variation between patients and volunteers is more pronounced in T2 relaxation time than for T2* relaxation time.
The Pearson’s correlation analysis between T2 and T2* has shown a significant positive correlation (correlation coefficient = 0.076 and p = 0.01) for asymptomatic volunteers and (correlation coefficient =0.165 and p = 0.01) for symptomatic patients.
The plots of T2* and T2 showed a slope equal to 0.056 with a correlation coefficient R2 = 0.0057 for asymptomatic volunteers and a slope equal to 0.118 with R2 = 0.027 for symptomatic patients (Fig. 3).
3.3. Correlation of T2 and T2* between 1.5T and 3T
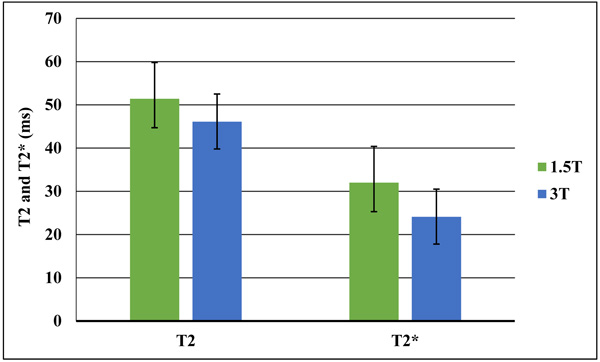
Mean T2 relaxation time values were 51.4±8.4 ms at 1.5T and 46.1±6.7 ms at 3T. For T2* relaxation time, mean values were 32±6.4 ms at 1.5T and 24.1±6.3 ms at 3T. There was a significant difference between 1.5T and 3T for T2 and T2* relaxation times (p = 0.01). Both T2 and T2* relaxation times values at 3 T were lower compared to those quantified at 1.5 T. The decrease of T2* is more pronounced than for T2 (Fig. 4).
4. DISCUSSION
Several studies have demonstrated that both T2 and T2* mapping can be useful to detect early stages of matrix degeneration that precede morphological cartilage damage and for postoperative evaluation after arthroscopic cartilage repair [14-20]. They can be used to evaluate the cartilage matrix status and identify biochemical changes associated with the early stages of osteoarthritis [9, 10, 14, 15, 20]. Our study mainly assesses the correlation between T2 and T2* relaxation times at 1.5T and 3T in addition to the evaluation of T2 and T2* at both magnetic fields. We used MESE sequence to quantify T2 relaxation time value and MEGE sequence to quantify T2* relaxation time value. Both MESE and MEGE sequences have the advantage of measuring many echoes during one Repetition Time (TR), which will save time with less risk of patient movement but MEGE, with its short TR compared to MESE, has the advantage of a short acquisition time. To minimize the T1 contribution in the image contrast and to obtain more signals, it was recommended to use a higher TR value compared to the T1 value of the cartilage, which was assumed around 600 ms. We have chosen a TR of 1500 ms for the T2 mapping sequence. Due to the shorter value of cartilage T2 relaxation time, short Echo Time (TE) and short echo spacing were required to accurately characterize the T2 decay curve. The recommended minimum number of echoes to get accurate curve fitting is 4 echoes and optimal is obtained when using 6 echoes. The expected T2 values of articular cartilage are in the range between 20 ms and 70 ms, so we used in our study 5 echoes times between 12.5 ms and 62.5 ms for 1.5 T and 6 echoes times between 12.5 ms and 75 ms for 3 T.
T2 relaxation time is the rate constant of proton dephasing in the transverse plane after a Radio Frequency (RF) pulse. T2* relaxation time is the transversal relaxation which results from inhomogeneity of main magnetic field. Both T2 and T2* reflect the articular cartilage change of the collagen fiber orientation in the extracellular matrix, water content and collagen content while higher values of T2 and T2* reflect cartilage degeneration [17-19]. Serval studies assessed T2 and T2* in articular cartilage knee at 1.5 T [8, 16, 21, 22]. Timothy and al evaluated the differences of T2 values in the femoral and tibial cartilages at 1.5T in patients with varying degrees of Osteoarthritis (OA) compared with healthy subjects, mean T2 values was 32.1–35.0 ms for healthy subjects and 34.4–41.0 ms for patients with mild and severe OA [16]. Our results correlated with previous reported studies in literature with mean T2 and T2* relaxation times values for asymptomatic volunteers were 47.6±10 ms for T2 and 32.3±7 ms for T2* and for symptomatic patients, values were 57.4±76.9 ms for T2 and 32.2±6.2 ms for T2*. There was a significant difference between asymptomatic volunteers and symptomatic patients for T2 relaxation time as well as for T2* relaxation time (p<0.05). The difference between asymptomatic volunteers and symptomatic patients in relaxation time is related to the biochemical changes associated with the early stages of osteoarthritis [9, 21]. T2 as well as T2* mapping have the potential to identify cartilage degeneration in early stage. The decreased collagen concentration and fiber orientation, and increased cartilage water content will result in higher T2 and T2* values [14, 21, 23].
Comparing the variation between asymptomatic volunteers and symptomatic patient in T2 and T2* relaxation time values, our results have shown that the variation is more pronounced in T2 relaxation time than T2* relaxation time. This variation can be explained by the high sensitivity of T2 relaxation time to the variation of water content and collagen content in the extracellular matrix of symptomatic patients.
Knee Osteoarthritis (OA) is characterized by progressive loss of articular cartilage which leads to disorders and functional failure of synovial joints [1]. Numerous studies have proved the feasibility and reproducibly of T2 and T2 * mapping in the diagnosis of cartilage degeneration even at 3T [9, 10, 18, 20, 24, 25]. Kim and al reported in their study conducted at 3T on nine tibial osteochondral specimens that the mean T2 relaxation values with different histological grades (0, 1, 2) of the cartilage were 51.9±9.2 ms, 55.8±12.8 ms, and 59.6±10.2 ms, respectively and that the mean T2* relaxation values with different histological grades (0, 1, 2) of the cartilage were 20.3±10.3 ms, 21.1± 12.4 ms, and 15.4±8.5 ms, respectively [24]. Mamisch and al reported also that global cartilage values in healthy volunteers were 52.3±5.6 ms for T2 and 22.6±3.8 ms for T2* [25]. Welsch and al compared and correlated T2 and T2* mapping in patients after matrix associated autologous chondrocyte transplantation (MACT) of the knee. They concluded that mean T2 values (ms) were comparable for the control cartilage (53.4±11.7) and the repair tissue (55.5±11.6) (p>0.05) and that mean T2* values (ms) for control cartilage (30.9±6.6) were significantly higher than those of the repair tissue (24.5±8.1) (p<0.001) [9]. In our study, mean T2 and T2* relaxation times values were 48.3±8.8 ms for T2 and 24.8±6.6 ms for T2* for asymptomatic volunteers and 51.1±10.8 ms for T2 and 24.8±7.7 ms for T2* for symptomatic patients respectively. There was a significant difference between asymptomatic volunteers and symptomatic patients for T2 relaxation time as well as for T2* relaxation time (p<0.05). Comparing the variation between asymptomatic volunteers and symptomatic patient in T2 and T2* relaxation time values, we found that the variation is more pronounced in T2 relaxation time than T2* relaxation time. The Pearson’s correlation analysis between T2 and T2* at 3T revealed a significant correlation (p<0.05) for asymptomatic volunteers and for symptomatic patients. Kim and al found a significant negative Pearson correlation between T2 and T2* (r= -0.322) on nine tibial osteochondral specimens at 3T. Also, Mamisch et al. have shown a significant positive Pearson correlation in the articular cartilage of the healthy volunteers and in healthy control cartilage of the patient (r=0.828, r=0.764) respectively. Welsch and al compared and correlated T2 and T2* mapping in patients after MACT of the knee. They concluded that zonal stratification was more pronounced for T2* than for T2 and that the correlation between T2 and T2* was highly significant (p<0.001), with a Pearson coefficient between 0.276 and 0.433 [9].
In our study, we scanned 10 patients in both 1.5T and 3T. Based on results, T2 values were lower at 3T compared to those at 1.5T. The percentage difference between T2 values was in the range between -6% and -21%. Since the increase of the main magnetic field strength B0 induces higher inhomogeneity because of the magnetic susceptibility and more chemical exchange of water protons with other acidic protons, T2 can be either B0-independent or decrease when increasing B0. Goetz H. Welsch and al reported in their study that the mean T2 values at 7 T were 41.8±5.5 ms which is significantly shorter compared with mean T2 values of 44.1±8.4 ms obtained at 3 T (p = 0.043). They reported also that mean T2 and T2* increased when going from 7 T to 3T [26]. Other studies showed that the T2 relaxation time in articular cartilage depends strongly on B0. A previous study reported that in the cartilage deep layer, the residual magnetization of the components with short T2 can still affect the first echo time signal at 3T, whereas at 7T, the contribution is not significant. They reported also that in the cartilage superficial layer with random fiber orientation, the effect of short T2 component is too small. In the deep layer, the T2 values were lower at 3T (32.7 ms) compared to 7T (35.1 ms) [26].
In our study, the mean T2* values for the 10 volunteers were in the range between 26.5 ms and 38.1 ms at 1.5T and between 17.8 ms and 31.2 ms at 3 T. So, we noticed that T2* is decreasing with higher magnetic field. H. Welsch and al reported that T2* were significantly lower at 7T compared with 3T (p<0.001) [26]. T2* reproducibility was reported to be good in the knee cartilage [27, 28]. A study conducted on cartilage femoral head of specimens showed a significant reduction of T2* values with higher Mankin scores [19]. Joint loading before the MRI exam must be considered since it affects both T2 values [29] and T2* [19, 30, 31].
All patients were well fixed with the joint space in the middle of the coil and the knee extended in the coil. Angular shape of the femoral and tibial cartilage with respect to the main magnetic field B0 may cause a change in the MR signal intensity because of the magic-angle effect. The maximum effect on T2 value was obtained when the collagen fibers in the cartilage were oriented at 55° relative to B0. So, curved articular surfaces such as the femoral condyle will have increased signals on short echo time images [32]. In our study, the problem is minimized since we compare the same region in all subjects. B. M. Wietek et al. reported in their study that not only T2 but also T2* is affected by the magic angle and the effect increases with the magnetic field strength [30, 33]. So, the evaluation of curved articular surfaces is difficult because T2 values change with the magic angle [18, 28, 34], which should not be misinterpreted as degeneration of the articular cartilage although a recent report reported that the effect of OA on T2 values is greater than the effect of the magic angle [35].
One limitation of this study is the lack of histological information. Further investigations in larger patient groups with histologic correlation would be beneficial in comparing T2 and T2* values. Also, studies in larger number of patients with different age and activity levels are needed to quantify correctly these biochemical mapping methods. In addition, the effect of the magic angle has to be understood and evaluated with high accuracy for both T2 as well as for T2* relaxation time mapping. The variation of T2 values because of the location of the cartilage site with respect to the main magnetic field has to be discussed since we know that the T2 measurements of cartilage may vary depending on the anatomic region of cartilage and its orientation relative to the main magnetic field. Another limitation of our study was the possible partial volume effect which was reduced by not including the superficial zone when drawing the ROIs. This could be solved by increasing the acquisition matrix to obtain a good in-plane spatial resolution but this will increase the scan time, which remains challenging for in vivo cartilage imaging. We evaluated the full thickness of the cartilage and did not subdivide the cartilage into additional sub-compartments because this requires a reduction of ROI areas which will affect the level of precision and reproducibility. The final limitation is the accuracy of the ROIs drawing between patients in 1.5 T and 3T. Having automatic segmentation using landmarks will reduce the risk of errors.
CONCLUSION
We reported in this study the correlation between T2 and T2* relaxation times at two different field strength (1.5 T and 3T) which shows lower T2 and T2* relaxation times at 3 T compared to 1.5 T and a significant correlation between T2 and T2* at 1.5 and 3T for symptomatic patients and asymptomatic volunteers. T2* mapping may be used for the diagnosis of knee articular cartilage osteoarthritis with the advantage of relative short scanning time, higher SNR, shorter echo times and the non-effect of the stimulated echo compared to T2 mapping.
LIST OF ABBREVIATIONS
| B0 | = The static magnetic field |
| Hz | = Hertz |
| MACT | = Matrix Associated Autologous Chondrocyte Transplantation |
| MEGE | = Multi-Echo Gradient Echo |
| MESE | = Multi-Echo Spin-Echo |
| MRI | = Magnetic Resonance Imaging |
| ms | = millisecond |
| OA | = Osteoarthritis |
| R2 | = Correlation Coefficient |
| RF | = Radio Frequency |
| ROI | = Region Of Interest |
| SD | = Standard Deviation |
| SNR | = Signal to Noise Ratio |
| T | = Tesla |
| TE | = Echo Time |
| TR | = Repetition Time |
| T2 | = The transverse relaxation |
| T2* | = The transvers relaxation caused by the inhomogeneity of B0 |
| γ | = The gyromagnetic ratio |
AUTHORS' CONTRIBUTIONS
- Mars Mokhtar adjusted MRI exam parameters, interpreted the patient data, and was a major contributor in writing the manuscript.
- Tbini Zeineb analyzed the patient data and was contributor in the interpretation of results and the writing of manuscript.
- Gharbi Souha was contributor in the discussion of results and in writing the manuscript.
- Mouna Chelli bouaziz performed the classification of patients and control the MRI exam.
- Ladeb Fethi: was contributor in the discussion of results.
-All authors read and approved the final manuscript.
AVAILABILITY OF DATA AND MATERIALS
The datasets used and /or analyzed during the current study are available from the corresponding author on reasonable request.
ETHICS APPROVAL AND CONSENT TO PARTICIPATE
The ethics commission of the Kassab Orthopedic Institute in Tunisia approved this study, the committee’s reference number is CE- IMKO 2015/105.
HUMAN AND ANIMAL RIGHTS
No animals were used for this research. All human research procedures followed were in accordance with the ethical standards of the committee responsible for human experimentation (institutional and national), and with the Helsinki Declaration of 1975, as revised in 2008.
CONSENT FOR PUBLICATION
Verbal and written consent was obtained from all patients prior to exam. All participants were adults, so, informed consent for participation in the study was obtained from participants.
CONFLICT OF INTEREST
The authors declare that there is no conflict of interest, financial or otherwise.
ACKNOWLEDGEMENTS
Special thanks to Pr Ali Mrabet for his support in the statistical evaluation.