NEMA NU4-2008 Performance Evaluation of Albira: A Two-Ring Small-Animal PET System Using Continuous LYSO Crystals
Abstract
Goals: This paper presents the performance review based on a dual-ring Positron Emission Tomography (PET) scanner being a part of Bruker Albira: a multi-modal small-animal imaging platform. Each ring of Albira PET contains eight detectors arranged as octagon, and each detector is built using a single continuous lutetium-yttrium oxyorthosilicate crystal and multi-anode photo multiplier tube. In two-ring configuration, the scanner covers 94.4 mm in axial- and 80´80 mm in trans-axial direction, which is sufficient to acquire images of small animals (e.g. mice) without the need of moving the animal bed during the scan.
Methods: All measurements and majority of data processing were performed according to the NEMA NU4-2008 standard with one exception. Due to the scanner geometry, the spatial resolution test was reconstructed using iterative algorithm instead of the analytical one. The main performance characteristics were compared with those of the other PET sub-systems of tri-modal small-animal scanners.
Results: The measured spatial resolution at the centre of the axial field of view in radial, tangential and axial directions was 1.72, 1.70 and 2.45 mm, respectively. The scatter fraction for the mouse-like phantom was 9.8% and for the rat-like phantom, 21.8%. The maximum absolute sensitivity was 5.30%. Finally, the recovery co-efficients for 5, 4, 3, 2, 1 mm diameter rods in image quality phantom were: 0.90, 0.77, 0.66, 0.30 and 0.05, respectively.
Conclusion: The Bruker Albira is a versatile small-animal multi-modal device that can be used for variety of studies. Overall the PET sub-system provides a good spatial resolution coupled with better-than average sensitivity and the ability to produce good quality animal images when administering low activities.
INTRODUCTION
In order to understand and effectively treat cancer, cardiovascular, neurological and other diseases, physicians and researchers have been using various imaging techniques for years. There are, however, aspects of those illnesses that cannot be readily studied in human subjects, such as the initial assessment of new drugs and the study of the early onset of the illness. For these and other purposes, animal models of human disease are required. Most of this research focuses on small animals, mainly rodents like mice and rats. Can human scanners be used to scan such subjects?
If we consider two of the nuclear imaging techniques, Positron Emission Tomography (PET) and Single Photon Emission Computed Tomography (SPECT), then the answer is no. The reason is that the accuracy of clinical PET or SPECT, while perfectly reasonable for human patients, becomes inadequate for animals so many times smaller and lighter than humans.Because of this issue a new class of imaging devices has emerged, which is usually referred to as small-animal (or pre-clinical) PET and SPECT.
There are now over a dozen commercially available small-animal PET scanners and a similar number of small-animal SPECT systems. Many of those systems combine nuclear imaging with X-ray computed tomography (CT). The benefit of such combination is that PET and SPECT provide “functional”, while CT provides “structural” information. Putting it simply, “functional” imaging provides molecular-level information while “structural” imaging provides contextual information about the location of molecular signals, such as the position of the bones and main organs. There is also, so far, one commercially available PET scanner integrated with Magnetic Resonance Imaging [1]. Depending on the settings, magnetic resonance may be used as both, functional and structural imaging technique and in combination with PET and SPECT may prove to be the most robust of available imaging tools.
There is also a number of commercial tri-modal, pre-clinical PET/SPECT/CT platforms including: Gamma Medica Triumph [2, 3], Siemens Inveon [4-6], MILabs VECTor [7] and Bruker Albira [8-12]. Table 1 summarises the basic information about PET systems within those three platforms. It is worth noting that VECTor PET uses collimators in order to detect single gamma photons coming from positron-electron annihilation events, unlike conventional PET systems based on coincidence detection of anti-parallel gamma rays produced by the same process. This approach improves spatial resolution; however, it vastly reduces the sensitivity of the scanner and makes it unsuitable for comparison with devices built upon different detection principles.
Summary of PET technologies used in small-animal tri-modal PET/SPECT/CT scanners with references.
| Sub-System Name |
Scintillating Crystals | Detector | Axial FOV |
Ring Diameter |
Reference | |
|---|---|---|---|---|---|---|
| Albira | PET | LYSO, 50(40)x50(40)x10 mm | MA-PMT | 40 mm 94.4 mm 148.8 mm |
111 mm | [9, 11, 12, 17] |
| Inveon | DPET | LSO, 1.51x1.51x10 mm | Block, 20x20 array, PSPMT | 127 mm | 161 mm | [4-6] |
| Triumph | LabPET8 LabPET12 |
LYSO/LGSO; 2x2x11.9 mm (LYSO); 2x2x13.3 (LGSO) |
Phoswich detector, 2 crystals per APD | 75 mm 112.5 mm |
162 mm | [2, 3] |
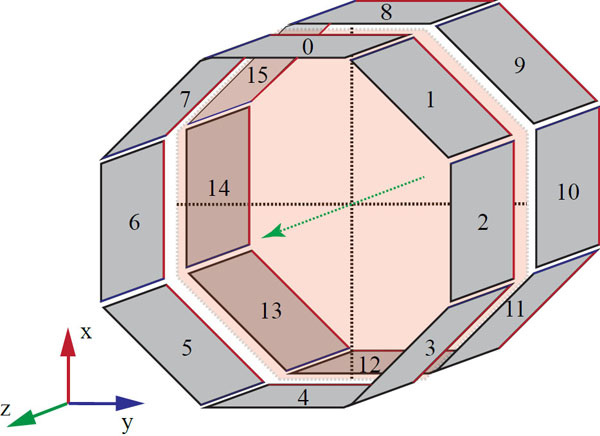
The geometry of 2-ring Albira PET. Note the gap between the adjacent rings and smaller gaps between the individual detectors within each ring.
The Bruker Albira (Bruker Biospin Corp., Billerica, MA, USA) is modular, i.e. it can be purchased as stand-alone PET, SPECT or CT scanner, or as any combination thereof and upgrades in the field are possible. Of all tri-modal PET/SPECT/CT scanners available on the market, it is the only one that implements continuous lutetium-yttrium oxyorthosilicate (LYSO) crystals technology with true and real-time depth-of-interaction detection and correction in its PET gantry. Detailed information regarding the PET detector construction has been already reported [1-8]. The SPECT and CT sub-systems were recently described in [12]. In summary, each of the crystals in the Bruker Albira PET has the shape of truncated pyramid with the base of 50×50 mm, 10 mm depth and 40×40 mm at the top virtually pixelated to a 300×300 grid. Behind the crystal lies a multi-anode position-sensitive photomultiplier tube coupled with the digital read-out board. Every PET ring contains eight detector modules forming an octagonal geometry. Fig. (1) with an aperture of 105 mm and a trans-axial field-of-view (FOV) of 80 mm diameter. The Bruker Albira PET is available in one-, two- or three-ring configuration providing 40 mm, 94.4 mm and 148.8 mm axial FOV coverage, respectively. An important feature in the multi-ring configuration is the 4.4 mm separation in the back between the tapered crystals comprising adjacent rings resulting in the gap of 14.4 mm in the front Fig. (2). The two-ring Albira PET, which is the scope of this work, provides the axial FOV sufficient for mice imaging without changing bed positions, however, is also the only one of the three configurations, where the gap between the rings encompasses the centre of the axial FOV of the scanner, which is a unique feature among the currently available small-animal PET scanners.

Dimensions of detectors in adjacent rings, highlighting the 14.4 mm gap between the fronts of the detectors. Dimensions in mm.
There are few parameters of the PET scanner that are used to characterize its performance. The spatial resolution defines how close two point sources can be for the scanner to be able to distinguish them. In image quality studies more complicated imaging phantoms are used and their purpose is to simulate more “real life” situation and how well scanner can differentiate among various phantom parts. It commonly involves uniform regions and “hot” and “cold” (radioactive and non-radioactive) features over “cold” and “hot” backgrounds, which allows to characterize how well those structures can be “recovered” on the image and how well contrast (in terms of radioactivity concentration) can be reproduced. Sensitivity measurements detail how this parameter varies in different parts of the field of view of the scanner (usually along the scanner axis). In count-rate studies the phantoms used are filled with high activities, higher than what is needed to saturate the detectors, so they cannot resolve the “flood” of incoming radiation, and imaged over time to show at which point the number of counts is proportional to the activity in the phantom. The parameter of interest here is the “peak” value, which shows at which activity the detectors are saturated and “scatter fraction”, which describes which part of the signal comes from the scattered events (as opposed to the real coincidences).
The National Electrical Manufacturer’s Association (NEMA) in its NU4 standard published in 2008 laid out guidelines for performance assessment of small-animal PET scanners [13]. It contains the four aforementioned tests, which allow for benchmarking of pre-clinical tomographs using the same standardized measurements and analysis. In principle it should be applicable to scanners using all kinds of geometry and detector technology. Indeed, since its publication, many systems were evaluated based on this standard. Results for most of the commercially available devices were reviewed and compared by Goertzen et al. [14]. The one-ring Albira PET results were published before [11] and recently Spinks et al. published evaluation of the triple-ring configuration, however, the latter followed custom protocol and not NEMA guidelines. Here, we present the first evaluation of the tri-modal dual-ring Bruker Albira PET according to NEMA NU4-2008 standard. To our knowledge results for this PET configuration of Bruker Albira PET have not been published to date. A comparison of the data obtained for the 2-ring Bruker Albira PET with other tri-modal PET/SPECT/CT systems in the literature and two other Albira PET configurations (where appropriate) is also outlined in this paper.
MATERIALS AND METHODS
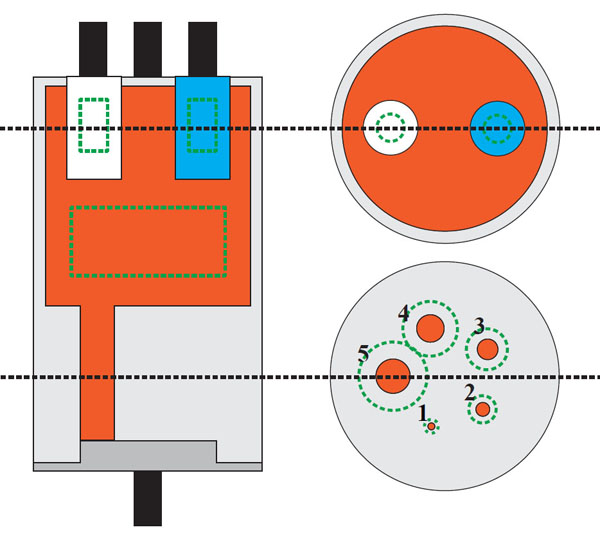
All phantoms used and measurements performed conformed with NEMA NU4-2008 protocol. A 22Na point-source Fig. (3), a 0.25 mm active sphere diameter of nominal activity of 370 kBq embedded in an acrylic cube of 10.0 mm extent on all sides (Eckert & Ziegler Isotope Products, Valencia, CA, USA), was used in spatial resolution and sensitivity measurements. The NEMA NU4 Image Quality phantom (QRM Quality Assurance in Radiology and Medicine GmbH, Moherendorf, Germany) is shown on Fig. (4). The schematic picture of mouse- and rat-like phantoms (Oncovision, Valencia, Spain) is shown at Fig. (5) (described in more detail in the count-rate performance section). All three were filled with 18F supplied by the West of Scotland PET Radiopharmaceutical Production Unit (Glasgow, UK). The coincidence timing window was 5 ns and the energy window was set to 50% (255-767 keV) for all tests except Image Quality and animal study, where the energy window was set to the manufacturer-suggested setting of 30% (358-664 keV). All acquisitions were acquired in list-mode. For sensitivity and count-rate performance evaluation a custom application was developed to construct and analyse sinograms. Spatial resolution data were reconstructed using STIR: Software for Tomographic Image Reconstruction [15] and by manufacturer-provided software. The results were analysed using AMIDE: Amide’s a Medical Imaging Data Examiner [16]. The Image Quality phantom was analysed using PMOD (PMOD Technologies, Zurich, Switzerland) and another custom application written for this purpose.
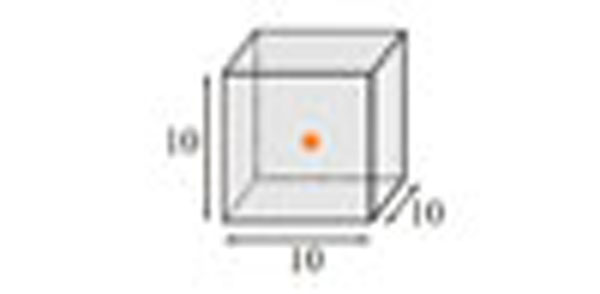
Spatial resolution and sensitivity point-source phantom. The radioactivity (orange asterisk) is contained within a 0.25 mm diameter sphere in the centre of the cube. Dimensions are in mm.

NEMA NU4 Image Quality Phantom. The picture shows a side view and two transverse slices through the phantom. Shades of grey represent phantom body and screws, white and blue represent the air- and water-filled chambers, respectively, orange shows radioactivity and green dashed line shows the volumes of interest measured within different areas of the phantom as described in the text.
Sensitivity
The point source was placed at the trans-axial centre of the FOV, at the edge of the axial FOV. A series of 60 second acquisitions were then taken, moving the source along the scanner’s axis in 1 mm steps to the other edge of the FOV. A background acquisition was acquired for 5 minutes without any source present in order to establish an intrinsic counts contribution from the LYSO crystals.
Count-rate performance phantom; (a) the body of the phantom, (b) a hole drilled 10 mm off-centre in respect to phantom's axis, (c) a line source (tube filled with radioactivity). Specific dimensions for mouse- and rat-like, phantom, vary and are described in the text.
All oblique lines-of-response were assigned to the appropriate axial slices using single slice re-binning and sinograms (trans-axial bin size of 1 mm, slice distance 1 mm) were constructed. In every slice, for every angle in the sinogram, the pixel of the maximum intensity was found and all counts outside 10 mm from that pixel were set to 0. All the remaining counts in every slice of the sinogram were summed and all constructed sinograms added together. Finally, background counts masked in the same manner and normalised to the scan duration were subtracted from each slice.
The system sensitivity for slice i (Si) expressed in counts per second (cps) per Bq was computed as follows:
 |
where Ri denoted a count rate in the slice i, RB,i is a normalised background count rate in that slice (both in cps) and Acal is the source activity expressed in Bq.
Considering the branching ratio of 22Na, which is 0.906, the absolute system sensitivity (SA,i)in the slice i expressed as a percentage can be calculated as:
 |
The system and absolute sensitivity over the mouse-region were obtained by summing Si and SA,i for the slices encompassing the central 7 cm of the scanner axis. Because the total axial FOV is less than 15 cm, rat-region and total sensitivity are equal, and calculated by summing the counts over all slices.
Spatial Resolution
The source was first positioned at the axial and trans-axial centre of the FOV. 60 second acquisitions were then taken at the radial offsets of: 0, 5, 10, 15, 20 and 25 mm. The same procedure was repeated for a quarter of the axial FOV (in our system 23.6 mm off the axial centre).
Using custom application data were filtered to include only events within 30% energy window. Then all data-points for both, 50 and 30% energy windows were reconstructed using reconstruction software provided by the manufacturer (MLEM, 20 iterations, 0.5 mm voxel size, no corrections applied) and using STIR (single slice re-binning and 2D FBP, 0.33 mm voxel size, no corrections applied). Normalization to correct for variations in detector efficiency was not applied for either energy window setting when using STIR.
COUNT RATE PERFORMANCE
Mouse-Like Phantom
The dimensions of the mouse-like phantom conformed to the NEMA NU4-2008 standard. Briefly, the phantom was made of high density polyethylene (0.96 ± 0.1 g/cm3) in the shape of a cylinder 70 ± 0.5 mm long and 25 ± 0.5 mm in diameter. A cylindrical hole of 3.2 mm diameter was drilled parallel to the central axis and at the radial distance of 10 mm to it. Tubing of 2.5 mm external diameter was filled with 143 MBq of 18F over 60 mm and threaded through the hole in the phantom, so the activity in the tubing was aligned with the central 60 mm of the phantom. The phantom was positioned in the middle of the FOV and a series of 20 min acquisitions were taken over several half-lives until the activity decayed to 44.8 kBq.
Rat-Like Phantom
The dimensions of the rat-like phantom conformed to the NEMA NU4-2008 standard. Briefly, the phantom was made of the same material as the mouse-like phantom and had a shape of cylinder 150 ± 0.5 mm long and 50 ± 0.5 mm in diameter. A cylindrical hole of 3.2 mm in diameter was drilled along the central axis at 17.5 mm radial offset. Tubing of 2.5 mm external diameter was filled with 233 MBq of 18F over 140 mm and threaded through the phantom, so the activity in the tubing was aligned with the central 140 mm of the phantom. After positioning the phantom in the centre of the FOV, a series of 20 minute acquisitions was taken until the activity decayed to 115.6 kBq.
Data Processing
Using single slice re-binning the data were re-binned into a stack of 2D sinograms using 1 mm pixel size and slice distance of 1 mm. All sinograms were masked so that only the pixels located within a band 16 mm wider than the diameter of the phantom were kept and the rest set to 0. Then for every row in a sinogram, the pixel with the greatest intensity was identified as representing the centre of the line source. Projections were shifted so these pixels coincided with the centre of the projection. After this alignment, the sum projection was produced by summing all vertical pixels for every radial offset. The counts within the central 14 mm of the summed projections represented the sum of true, random and scattered events while the counts outside this strip are considered to contain only random and scattered events. Using linear interpolation the pixel values at the borders of the above strip were calculated and their average multiplied by the number of pixels between them. The product of this multiplication was assumed to represent random and scattered events within the strip and by subtracting this from all events within the strip, the true counts were found. The total counts were found as a sum of all events in the sum projection. By subtracting the true counts from total counts, random and scattered events were calculated.
Event count-rates (Ri,j) for slice i of the acquisition j were calculated by dividing respective counts by the duration of acquisition:
 |
Using acquisition taken at low activity, when count losses and random events were less than 1.0% of total events rate, scatter fraction (SF) was calculated as:
 |
where Rs is scattered- and Rt a true-event rate.
Next, for slice i of acquisition j, the noise-equivalent-rate (RNEC,i,j) was computed as:
 |
where RTOT,i,j denotes total and Rt,i,j - true event rate.
The true event rate within the ± 7 mm band from the edge of the line source in every slice i of the acquisition j was computed as:
 |
Random event rate Rr,i,j was estimated as follows:
 |
Scattered event rate Rs,i,j was then calculated as:
 |
where Rint,i is intrinsic event rate derived from a scan of each phantom without any activity in the tubing.
Summing over all slices i for every acquisition j the scatter fraction was calculated as:
 |
Image Quality Phantom
The phantom was filled with 3.55 MBq of 18F, positioned centrally within the FOV and imaged for 20 minutes. The image was then reconstructed using Albira built-in reconstruction software with a 0.5 mm voxel size (the smallest available) and MLEM algorithm using variable number of iterations: from 2 to 100. Scatter, randoms and decay corrections were applied for every reconstruction.
Using PMOD software, a cylindrical volume of interest (VOI) (22.5 mm diameter and 10 mm length) was drawn over the centre of the homogeneous region. Maximum, minimum, mean and standard deviation values were noted. Next, a cuboid VOI was drawn over the rods region, covering the slices over the central 10 mm of their length. The image was cropped to this VOI and slices averaged to lower the noise. Circular ROIs twice the physical size of each rod were drawn around them and the maximum intensity pixel within each ROI was identified. Using transverse co-ordinates of the maximum intensity pixels, line profiles through all rods were generated. The recovery coefficients (RC) for every rod were calculated as the ratio of the average counts, Meanlineprofile for the rod along the generated profile to the average counts in the uniformity region, Meanbackground. The error on this value was calculated as:
 |
where STDlineprofile and STDbackground refer to the standard deviation calculated for the line profile and the uniformity region, respectively.
To estimate the accuracy of corrections, two cylindrical VOIs, each 4 mm in diameter and 7.5 mm long, were drawn centrally over air- and water-filled chambers. Spill-over ratios were calculated as the ratio of the mean activity concentration within the VOIs to the mean counts within the uniformity region. The %STD was calculated similarly to above.
Animal Study
An animal imaging study was conducted according to the guidelines set forth by the eight edition of Guide for the Care and Use of Laboratory Animals and the animal welfare authority in UK, and within an appropriate project licence.
A 6-weeks-old male healthy KPC (KrasG12D/+; Trp53R17H/+; Pdx1-Cre) mouse (22.7 g) was anaesthetised with 2.5% isoflurane gas and medical air mixture and injected through the tail vein with 3.9 MBq of 18F-NaF. After placing the mouse on the imaging bed it was immediately imaged using a dynamic acquisition consisting of variable length frames (1 min to 10 min) for a total time of 90 minutes. This was followed by a two-bed CT scan. The PET images were reconstructed using MLEM 20 iterations, 1×1×0.944 mm voxel size (random, scattered and decay corrections applied) and the CT image was reconstructed using FBP. Attenuation correction was not applied. The last three frames of the PET image, covering the last 30 minutes of the acquisition, were then averaged and a maximum intensity projection was generated in PMOD.
RESULTS
Sensitivity
The absolute sensitivity profile for 50% (255-767 keV) and 30% (358-664 keV) energy windows are shown in Fig. (6). The peak absolute sensitivity, corresponding to the centre of the scanner’s FOV and the gap between the rings, is 5.30% at 50% energy window. The two outer peaks correspond to the centre of both rings. The average absolute sensitivity over the mouse region is 3.0% and over the rat region (encompassing the whole FOV) is 2.33%.
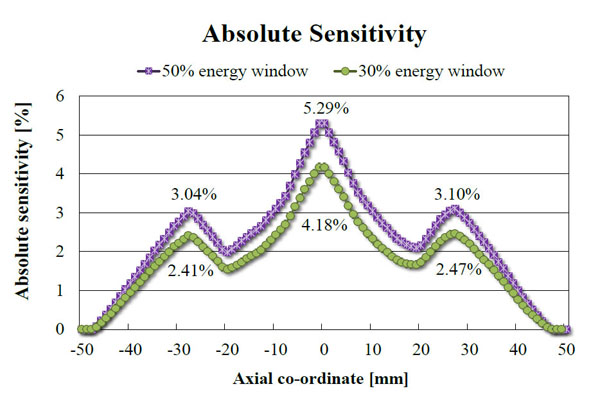
Absolute sensitivity of the 2-ring Bruker Albira PET scanner measured along the axis using two energy windows: 255-767 keV (50%) and 358-664 keV (30%).
Spatial resolution measured using the 2-ring Bruker Albira PET and 22Na point-source.
| At Axial Centre | |||||||||||||
|---|---|---|---|---|---|---|---|---|---|---|---|---|---|
| 0 mm | 5 mm | 10 mm | 15 mm | 20 mm | 25 mm | ||||||||
| Algorithm | FWHM | FWTM | FWHM | FWTM | FWHM | FWTM | FWHM | FWTM | FWHM | FWTM | FWHM | FWTM | |
| Radial | MLEM | 1.72 | 3.13 | 1.68 | 3.06 | 1.93 | 3.52 | 2.24 | 4.08 | 2.58 | 4.71 | 2.81 | 5.12 |
| FBP | N/A | ||||||||||||
| Tangential | MLEM | 1.70 | 3.10 | 1.75 | 3.19 | 1.63 | 2.97 | 1.68 | 3.07 | 1.74 | 3.17 | 1.95 | 3.55 |
| FBP | N/A | ||||||||||||
| Axial | MLEM | 2.45 | 4.47 | 2.44 | 4.44 | 2.44 | 4.45 | 2.62 | 4.78 | 2.81 | 5.11 | 2.77 | 5.05 |
| FBP | N/A | ||||||||||||
| At /14; Axial FOV from Centre | |||||||||||||
| Radial | MLEM | 1.52 | 2.78 | 1.55 | 2.83 | 1.86 | 3.39 | 2.13 | 3.89 | 2.33 | 4.25 | 2.79 | 5.08 |
| FBP | 1.78 | 3.24 | 1.92 | 3.50 | 2.59 | 4.73 | 5.14 | 9.37 | 6.81 | 12.42 | 7.91 | 14.41 | |
| Tangential | MLEM | 1.69 | 3.07 | 1.60 | 2.91 | 1.58 | 2.8 | 1.65 | 3.01 | 1.66 | 3.02 | 1.95 | 3.55 |
| FBP | 1.72 | 3.13 | 1.31 | 2.38 | 1.57 | 2.87 | 1.14 | 2.07 | 0.90 | 1.63 | 1.01 | 1.84 | |
| Axial | MLEM | 1.45 | 2.64 | 1.42 | 2.59 | 1.48 | 2.69 | 1.55 | 2.83 | 1.52 | 2.78 | 1.62 | 2.96 |
| FBP | 2.47 | 4.51 | 2.59 | 4.72 | 2.69 | 4.89 | 2.59 | 4.72 | 3.26 | 5.95 | 3.06 | 5.57 | |
Reconstructed image pixel size (mm): 0.5¬ / 0.33 Slice thickness (mm): 0.5 / 0.33
Spatial Resolution
The spatial resolution results for the 30% energy window are gathered in Table 2. The best spatial resolution was measured at ¼ of the axial FOV, at 5 mm radial offset and was 1.55, 1.60 and 1.42 mm in radial, tangential and axial direction, respectively, using MLEM algorithm. The comparison between 30 and 50% energy window is shown in Fig. (11). In the dual-ring configuration it is not possible to reconstruct images of a point source positioned along the axial centre of the FOV using single slice re-binning and FBP. The problem arises because the centre of the FOV corresponds to aforementioned 14.4 mm gap between the two detection rings. Because ¼ of the axial FOV lies within 5 mm from the centre of the crystal, the observed spatial resolution at this position was better than in the axial centre of the FOV.

Absolute sensitivity of the 2-ring Bruker Albira PET scanner measured along the axis using two energy windows: 255-767 keV (50%) and 358-664 keV (30%).
Count-Rate Performance
The count rate performance for both phantoms is presented in Fig. (7). The scatter fraction is 9.8% for the mouse-like phantom and 21.8% for the rat-like phantom. The RNEC, peak is 72 kcps at 205.4 kBq/ml for the mouse-like phantom, and 42 kcps at 39.9 kBq/ml for rat-like phantom.
Image Quality Phantom
The results of image quality study are given in Tables 3 and 4 for 20 iterations of MLEM. The RCs for the different sized rods range from 0.05 to 0.90. The %STD within the uniformity region is 4.9%.
Recovery Coefficients (RCs) for rods of different diameters measured using NEMA Image Quality phantom and the 2-ring Bruker Albira PET system.
| Rod Diameter | Recovery Coefficient | %STD |
|---|---|---|
| 1 mm | 0.05 | 29.0 |
| 2 mm | 0.30 | 14.5 |
| 3 mm | 0.66 | 14.8 |
| 4 mm | 0.77 | 10.2 |
| 5 mm | 0.90 | 8.5 |
Accuracy of corrections calculated for the 2-ring Bruker Albira PET system for water- and air-filled chambers in the NEMA Image Quality phantom.
| Region | Spill-Over Ratio | %STD |
|---|---|---|
| Water-filled cylinder | 0.219 | 12.3 |
| Air-filled cylinder | 0.139 | 14.1 |
Animal Study
Fig. (8) presents a mouse bone study. Some vertebrae can be distinguished in the caudal region of the spine with apparent degradation of the spatial resolution towards the centre of the FOV. All major joints are visible.
Comparison of Systems
Count-rate performance data for the 2-ring Bruker Albira and other tri-modal scanners are summarised in Table 5. In Table 6 the sensitivity of all tri-modal PET/SPECT/CT systems are shown and Table 7 presents a comparison of RCs obtained from Image Quality phantom analysis in the 2-ring Bruker Albira PET and other tri-modal PET/SPECT/CT systems.
| Mouse Phantom | Rat Phantom | |||||
|---|---|---|---|---|---|---|
| RNEC,peak [kcps] | Activity [MBq] | Scatter Fraction [%] | RNEC,peak [kcps] | Activity [MBq] | Scatter Fraction [%] | |
| 1-ring Albira PET | 16.9 | 12.7 | 7.5 | 12.8 | 12.4 | 13.0 |
| 2-ring Albira PET | 72 | 7.1 | 9.8 | 42 | 11.8 | 21.8 |
| Inveon DPET | 1670 | 131 | 7.8 | 592 | 110 | 17.2 |
| Triumph LabPET8 | 279 | 82 | 15.6 | 94 | 91 | 29.5 |
| Triumph LabPET12 | 362 | 81 | 16.0 | 156 | 83 | 29.3 |
| Energy Window [keV] | Absolute Peak Sensitivity | Absolute Total Sensitivity | Absolute Total Sensitivity (Mouse Region) | |
|---|---|---|---|---|
| 1-ring Albira PET | 255-767 | 2.5% | 1.5% | 1.5% |
| 2-ring Albira PET | 255-767 | 5.30% | 2.33% | 3.0% |
| Inveon DPET | 350-625 | 6.72% | 2.8% | 4.0% |
| Triumph LabPET8 | 250-650 | 2.36% | 1.42% | 1.45% |
| Triumph LabPET12 | 250-650 | 5.4% | 2.74% | 3.6% |
| 1 mm | 2 mm | 3 mm | 4 mm | 5 mm | |
| 1-ring Albira PET | 0.02 | 0.11 | 0.38 | 0.60 | 0.73 |
| 2-ring Albira PET | 0.05 | 0.30 | 0.66 | 0.77 | 0.90 |
| 3-ring Albira PET | 0.03 | 0.19 | 0.63 | 0.84 | 0.95 |
| Inveon DPET | 0.17 | 0.48 | 0.72 | 0.84 | 0.93 |
| Triumph LabPET8 | 0.19 | 0.78 | 0.97 | 1.00 | 1.02 |
| Triumph LabPET12 | 0.24 | 0.77 | 0.92 | 0.93 | 0.97 |
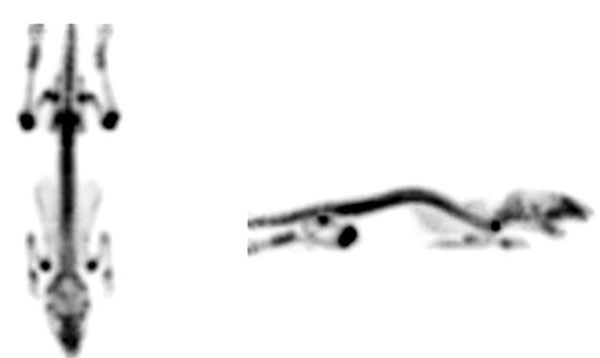
Mouse study conducted using 3.9 MBq of 18F-NaF. Image reconstructed using the default reconstruction settings: MLEM, 20 iterations, 1x1x0.944 mm voxel size with randoms, scattered and decay corrections applied. An image of the averaged last three 10 min frames of the 90 min dynamic acquisition started at injection time is shown. Maximum intensity projections (MIP): coronal (left) and sagittal (right) show parts of the cranium, joints and some of the vertebrae in the mouse tail. It demonstrates the ability of the 2-ring Bruker Albira to produce good quality of images using small activities and short imaging times.
DISCUSSION
Recently, Goetzen et al. [14] provided a summary of NEMA results for most commercially available pre-clinical PET scanners. This summary, however, does not include the 1-ring Bruker Albira PET [11]. Lately, Spinks et al. [17] have published performance data for all three modalities of Albira, including the 3-ring PET. Their work, however, does not follow NEMA guidelines, in particular the count rate performance and sensitivity results were not analysed according to the protocol and therefore cannot be directly compared to our work. In this manuscript we have evaluated the 2-ring configuration of the Bruker Albira PET according to the NEMA NU4-2008 standard for small-animal PET scanners. We also compare it with other PET sub-systems within pre-clinical tri-modal PET/SPECT/CT scanners and the 1-ring Bruker Albira PET variant and, where possible, the 3-ring one.
The absolute sensitivity of the 2-ring Bruker Albira PET (5.30%) is lower than the Inveon DPET (6.72%), but in concordance with the value quoted by the manufacturer for this configuration (greater than 5%). The 3-ring Albira PET in the initial evaluation shown by Spinks et al. [17] showed the peak absolute sensitivity of 6.7% for the 358-664 keV energy window, however, since the data were not analysed according to NEMA protocol, they cannot be directly compared with ours. The RCs presented in this work were calculated for images reconstructed using MLEM 20 iterations and are lower for 2-ring Bruker Albira than other tri-modal PET/SPECT/CT scanners. However, when 100 iterations were used the RCs (0.16 for 1 mm rod up to 0.89 for 5 mm rod) were closer to the values of Inveon DPET (0.17 for the 1 mm rod up to 0.93 for the 5 mm one). Figs. (9, 10) show the dependence of RC and spill-over ratio values, respectively, on the number of MLEM iterations used during the reconstruction. The spill-over ratios also improved with 100 iterations (4% for the air-filled chamber and 13.9% for the water-filled chamber). These spill-over ratios are still higher than those calculated for the Inveon DPET (-0.6% for the air- and 1.7% for the water-filled chambers), but it is worth noting that no attenuation correction was applied to the Bruker Albira PET images as our system does not offer such feature. As expected, the results published by Spinks et al. show that with the CT-based attenuation correction the RCs for Albira can be as high as 0.95 for 5 mm rod. We can therefore assume that our results would improve if such correction was applied. NEMA standard suggests using voxel size which is 1/5 of the expected spatial resolution. However, using smaller voxel sizes and in turn larger image matrices, leads to longer reconstruction times and may not improve the results significantly. Indeed, Spinks et al. showed for their system that the difference in spatial resolution between 0.5 and 0.4 mm voxel to be around 0.1 mm, yet according to the manufacturer, the reconstruction using the smaller voxel size takes over twice as long. Furthermore, NEMA standard assumes the plane of the best spatial resolution to be around the centre of a scanner, around the cross-section of the axial and trans-axial fields of view. Subsequently the protocol requires quoting results from that region, however, the plane, where the best spatial resolution can be achieved depends on the scanner geometry and may be different for scanners employing non-cylindrical detector arrangement and/or non-pixelated detector designs. As an example of this particular kind of scanner, in 2-ring Bruker Albira PET the best spatial resolution can be achieved in the centre of the individual ring and not in the centre of the scanner. Because for 1 and 3-ring variation of Albira PET the axial centre of the scanner and the centre of the ring coincide, only the 2-ring configuration is disadvantaged in this way.
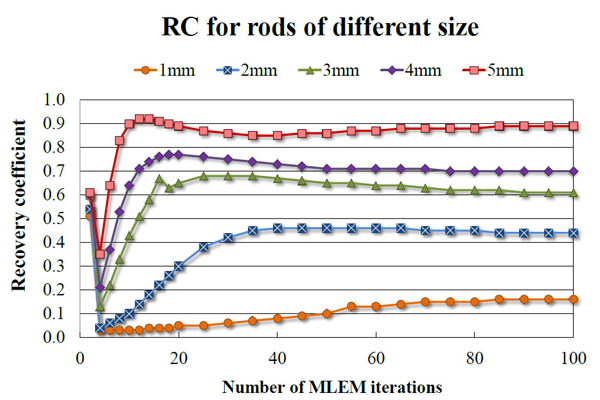
RCs determined for the 2-ring Bruker Albira PET for all rods as a function of the number of MLEM iterations.
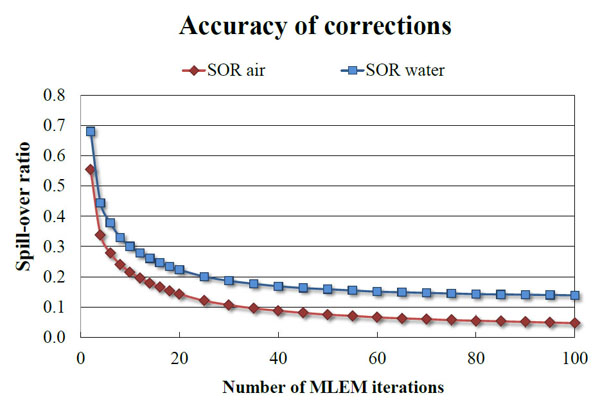
Accuracy of corrections for water- and air-filled chambers using the 2-ring Bruker Albira PET as a function of the number of MLEM iterations.
Compared with the 1-ring Bruker Albira PET, the 2-ring variation has twice the peak absolute sensitivity (5.3% as opposed to 2.5%) and a distinctively different axial sensitivity profile. Instead of a triangle-shape, one can observe two minor peaks corresponding to the centres of individual rings of the sub-system, which are in agreement with results reported for the 1-ring Bruker Albira PET. In practical terms, Morran et al. [18] have recently shown that the sensitivity of the two ring system is sufficient to detect differences in 18F-FLT uptake between pancreatic tumours from two different mouse models of pancreatic ductal adenocarcinoma following treatment with the mTOR inhibitor rapamycin.
The count-rate performance profiles for the 2-ring Bruker Albira PET for mouse- and rat-like phantoms peak at much lower activities (7.1 MBq and 11.8 MBq for mouse- and rat-like phantoms, respectively) than reported for other tri-modal scanners (Table 5). This is because of the common readout electronics used in the detector design, which cause them to saturate much quicker. However, it still provides a lower scatter fraction for both phantoms (9.8% and 21.8% for mouse- and rat-like phantoms, respectively) than both Triumph sub-systems (15.6-16% and 29.3-29.5%, respectively). On the other hand, the Bruker Albira PET is the only system among this group, which implements true and real-time depth of interaction-correction. LabPET8 and 12 in the Triumph system, use phoswich detectors made of two crystal layers. By determining the layers, where the coincidence was detected one can achieve depth of interaction-correction limited to 4 discrete states. Conversly, Bruker Albira PET is able to distinguish the continuous depth within the crystal, where the photon was detected and correct for the parallax error.
NEMA NU4 provides a standardized set of tests allowing performance assessment of small-animal PET scanners, yet it is the device’s ability to produce the image that ultimately decides of its usefulness. As pointed out by Zanzonico [1], the radiation doses absorbed by small animals in pre-clinical studies are of one to two orders of magnitude higher than those in analogical clinical studies and therefore, may cause adverse effects in the animals. The mouse image we present (Fig. 8) was acquired using 3.9 MBq of 18F-NaF as opposed to the average 9 MBq reported for other systems. This supports the ability of the Bruker Albira PET to acquire images at low administered activities and short acquisition times, which is an important consideration when animal radiation exposure is paramount.
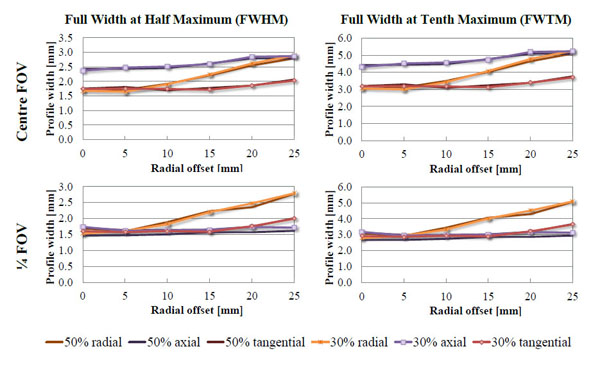
Spatial resolutions obtained on 2-ring Albira PET system shown as Full Width at Half or Tenth Maximum in radial, axial and tangential directions measured at the axial centre and quarter of the field of view (FOV) expressed as a function of radial offset. Solid line depicts the resolution measured using 50% energy window (255-767 keV) and the dashed line is the same measurement at 30% energy window (358-664 keV). The shape of the curves remains the same at both axial offsets and the differences between the values acquired at both energy windows are minimal. One can also observe that the spatial resolution is better at the quarter of the FOV, which is due to the proximity of the ring centre as opposed to the centre of the scanner, which overlaps with the gap between the rings.
It has been pointed out [19] that NEMA NU4-2008 might not be suitable for use with all small-animal PET systems. Furthermore, it was observed [14] that the standard favours scanners with cylindrical ring geometry. It is clear that the 2-ring Bruker Albira, despite the 14.4 mm gap between the rings, is capable of producing high quality animal images and yet it was not possible to reconstruct images of the point source placed along the centre of the axial FOV using FBP and single slice re-binning. We postulate that for systems with non-standard geometry, iterative reconstruction algorithms are allowed in spatial resolution part of the NEMA protocol.
CONCLUSION
The Bruker Albira is a versatile small-animal multi-modal device that can be used for a variety of studies. The LYSO crystal detector technology used in the PET component assessed in this work provides overall good spatial resolution coupled with better-than average sensitivity, and has the ability to produce good quality animal images. Based on recent developments on the Bruker Albira platform, further performance improvements can be expected.
ABBREVIATIONS
CONFLICT OF INTEREST
The authors confirm that this article content has no conflict of interest.
Acknowledgements
Authors would like to thank Dr Gerry Gillen and Dr Jonathan Owens for their support in this project.
M. Pajak is a Ph.D. student funded jointly by the SINAPSE Collaboration (http://www.sinapse.ac.uk), a Pooling Initiative funded by the Scottish Funding Council and the Chief Scientist Office of the Scottish Executive and Carestream Molecular Imaging.


