All published articles of this journal are available on ScienceDirect.

Socioeconomic Health Disparities in Canadian Regions
Abstract
Purpose:
Numerous studies have estimated health disparities along socioeconomic dimensions using individual data from sample surveys. Disparities between communities or regions cannot be estimated without a consistent set of individual data across communities. This study uses data at the health region level to estimate the socioeconomic health disparities between health regions in Canada.
Methods:
Tow measures of income and a measure of education are used for regional socioeconomic ranking along with several health outcomes such as life expectancies, mortality rates, perceived health and obesity. Weighted regressionanalysis is used to estimate the relative inequality index (RII) between Canadian health regions.
Results:
The findings of the study indicate the existence of health disparities between Canadian health regions along the three socioeconomic markers of average income, median household income and education in favor of regions with higher socioeconomic ranking on those markers. Disparities are more pronounced along the education and average income dimensions, however. Greater inequalities are observed for premature mortality, avoidable mortality and obesity, which are higher for women than men.
Conclusion:
There are health disparities between Canadian health regions along education and income dimensions. Such disparities signify the role of socioeconomic factors as important instruments in reducing health disparities.
1. INTRODUCTION
The research community is increasingly aware of the multifaceted nature of population health. Many researchers have examined factors well beyond the traditional realm of health care services and individual life styles. The impact on health of the broader societal and environmental context in which populations live and die are now well documented [1-6]. The evolving paradigm of Social Determinants of Health includes various approaches to health determination that recognize the role of contextual social, economic, and political factors as fundamental determinants underlying the health of individuals and populations [7-11].
The recognition of the contributions of socioeconomic factors to health outcomes has created widespread interest in socioeconomic health inequalities or disparities. Many studies have estimated socioeconomic health inequalities. The complexity of the relationships between socioeconomic factors and health outcomes as well as the difficulty of measuring some of these resources has led researchers to predominantly focus on income as the key socioeconomic marker. Income data is vastly collected and it is much easier to use for ranking individuals or groups of individuals. Thus, income related health inequalities have been estimated in different countries at local, state or national levels [12-18]. Estimates of income related health inequalities are normally based on individual data collected from sample surveys. Such data provide a rich set of information for estimating intra group health inequalities. However, unless linked to appropriate data at the community or group level, individual data are not suitable for estimating inter community or between group inequalities. Moreover, population health data such as mortality or life expectancy can only be defined at the community or population level. That limits health outcome measures used in studies based on individual data to categorical variables such as self-rated health [19-21], or constructed continuous indexes of morbidity or functional health such as health utility index [22].
Using aggregate health data at the community or regional level allows for direct estimation of health disparities between the communities or regions. It also expands the range of measurable health outcomes to mortality rates and life expectancies, and provides continuous data on categorical health outcomes as measured by proportions defined for a community or region as a whole such as the proportion of people with poor health. A potential problem when using aggregate data at the communal or regional level could be the limited number of communities or regions (spatial units) that would constrain statistical inference. Fortunately, for the purposes of this study, health and socioeconomic data are available for well over a hundred health regions across Canada that cover the entire population of the country. Health regions are administrative boundaries that fall within the jurisdiction of a particular regional health authority. These regions are defined by the provincial Ministries of Health for each province. For complete coverage of Canadian population, each of the three northern territories (North Western Territory, Yukon and Iqaluit) also represents a health region.
The study uses Canadian aggregate health data along with socioeconomic data to estimate socioeconomic health inequalities between various health regions across Canada. It utilizes the widely used Relative Inequality Index (RII) to estimates inequalities. It finds health inequalities along the socioeconomic dimensions of income and education that consistently favor regions with higher socioeconomic standings. The health inequalities are found to be generally higher along the education dimension compared to average income and median household income. They are more pronounced for pre-mature and avoidable mortality rates as well as obesity. The latter inequalities are found to be grater for women than men.
The rest of the paper is organized as follows. Section 2 provides a conceptual model of how various socioeconomic determinants of health may affect health. Section 3 describes the data and explains the methodology. The results of the study are reported and discussed in Section 4. Section 5 concludes the paper.
2. A CONCEPTUAL MODEL OF HEALTH
It is generally agreed that socioeconomic factors have significant bearings on people’s health. The exact mechanisms or pathways through which socioeconomic factors affect individual’s health are less known, however. The following conceptual model, depicted in Fig. (1), attempts to identify some of the pathways at a very broad level.
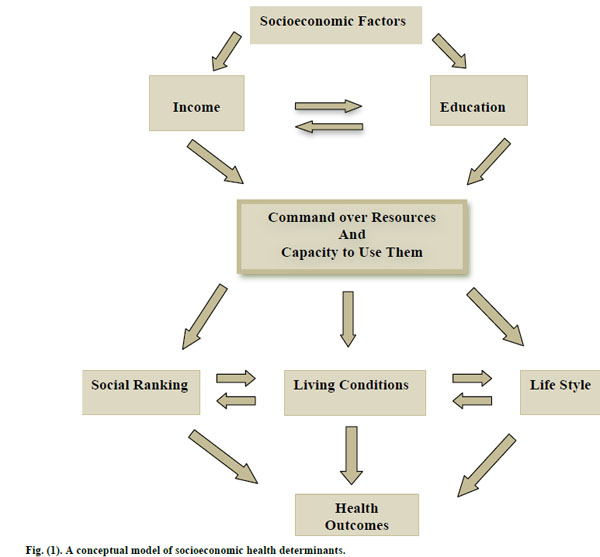
A conceptual model of socioeconomic health determinants.
As shown in Fig. (1), socioeconomic factors can be identified by income and education among other things. These factors are inter-related as indicated by the arrows. For instance, education determines income, and at the same time income influences educational attainment. The confluence of income and education determine people’s command over the resources as well the capacity to make effective use of resources. Income determines the quantity and quality of material amenities of life at one’s disposal. Education affects the efficacy of using or consumption of resources. Command over resources and the capacity to use them essentially determines one’s position in social hierarchy or social ranking which is shown to be independently affecting people’s health and wellbeing [23-27]. It also defines the day-to-day living conditions we grow in with immediate consequences for how we feel and perceive life and what kind of risks or rewards we are exposed to. Life style choices are also greatly affected by our command over resources and the way we use them. Social ranking, living conditions and life style choices are also interrelated. Social ranking affects living conditions and the latter frames and shapes individual behaviors and life style choices. The pillars of social ranking, living conditions and life style have significant bearing on health and wellbeing beyond the compositional factors of genetics and demography.
The above conceptual model can be expanded to elucidate specific pathways at various levels. For our purposes here, it suffices to recognize the underlying roles of the key socioeconomic factors of income and education. As explained in the following sections, this study focuses on measuring health inequalities between the regions that arise from differences in income and education.
3. DATA AND METHODOLOGY
3.1. Data
Aggregate health data from up to 117 health regions (communities) in 10 provinces and 3 territories in Canada are used to estimate regional health inequalities along the socioeconomic dimensions of income and education. The data are obtained from various tables of the database CANSIM, provided by Statistics Canada and the Canadian Institute for Health Information. In majority of cases the data are 3-year averages over the period 2007-2009. However, in a few cases, the data are averages for 2005-2007 or a single year like 2005 or 2006. These are the most recent data available at the regional level. The health data used in this study consist of life expectancy at birth (LEB) and at age 65 (LE65) in years, premature mortality rate per 100,000 population (PMMR) which measures mortality before the age of 75, avoidable mortality rate per 100,000 population (AVMR) which is mortality due to preventable causes, proportion of people who self-reported poor or fair health (SRPH), proportion of obese people (OBESITY), infant mortality rate (IMR) and prenatal mortality rate (PNMR) per 1000 live births. As for the socioeconomic data, two measures of income are used – one is average personal income and the other is household median income. Education variable is the proportion of population in a region with post-secondary education.
To get a sense of health variations across the health regions, Table 1 describes the health outcomes summary data for each of the 10 so-called peer groups as defined by Statistics Canada using a statistical method to achieve maximum statistical differentiation between health regions on the basis of 24 variables. The variables cover a wide range of areas including demographic structure, social and economic status, ethnicity, Aboriginal status, housing, urbanization, income inequality and labour market [28]. Hence, peer groups are collections of health regions that have similar socioeconomic characteristics and are identified by groups A to J.
As Table 1 shows, there are substantial differences in health outcomes across the 10 peer groups. The variation in LEB is over 10.2 years and that of LE65 is 4.6 years. PMMR and AVMR vary over 237 and 169 (both per 100,000 population), respectively. Variation in IMR and PNMR is also sizable at 7.3 and 6.3 (per 1000 live births), respectively. As well, variation in OBESITY and SRPH is considerable with magnitudes of 17.8 and 5.9, respectively. It should be noted that health outcomes across the peer groups follow the same pattern. That is, in general peer groups with longer life expectancies such as Groups B, G and J, have lower mortality rates and lower obesity and self-rated perceived poor health.
Health outcomes across the regional peer groups.
| Peer Groups | LEB | LE65 | PMMR | AVMR | IMR | PNMR | OBESITY SRPH | |
|---|---|---|---|---|---|---|---|---|
| Peer Group A | 80.8 | 19.9 | 327.1 | 235.2 | 4.7 | 5.2 | 18.3 | 11.0 |
| Peer Group B | 81.8 | 20.5 | 242.5 | 176 | 4.8 | 5 | 17.2 | 9.9 |
| Peer Group C | 79.9 | 19.4 | 376.9 | 274 | 4.8 | 5.6 | 21 | 13.3 |
| Peer Group D | 80.5 | 19.9 | 348.9 | 250.3 | 5.2 | 6.1 | 20.4 | 11.4 |
| Peer Group E | 79.3 | 19.3 | 301.6 | 227.1 | 6.4 | 7.4 | 23.1 | 11.5 |
| Peer Group F | 73 | 16.7 | 385.7 | 300.4 | 11.6 | 10.9 | 29.7 | 11.5 |
| Peer Group G | 82.4 | 21.1 | 257.6 | 187.4 | 5.4 | 6.1 | 11.9 | 11.5 |
| Peer Group H | 78.4 | 19.1 | 380.9 | 285.1 | 6.9 | 7.3 | 21.9 | 12.6 |
| Peer Group I | 79.3 | 19 | 435.7 | 310.6 | 4.5 | 7.3 | 22.9 | 15.8 |
| Peer Group J | 83.2 | 21.3 | 198.1 | 141.4 | 4.3 | 4.6 | 12.2 | 11.0 |
3.2. Methodology
The study uses weighted regression models to estimate the widely used relative inequality index (RII). RII and the closely related concentration index (CI) have been shown to possess desirable properties for a health inequality index [29]. Although a study on the welfare economics foundation of health inequality measures questions the arbitrariness and acceptability of the equity weights implied in the CI [30], both CI and RII are still widely used measures of socioeconomic health inequalities. The CI is defined in terms of a concentration (Lorenz) curve that plots the cumulative proportion of the population ranked by socioeconomic status (e.g. income) beginning with the lowest status against the cumulative proportion of health or ill health measured by a continuous index. It is defined as twice the area between the Lorenz curve and the diagonal. It takes a negative value when ill health is more concentrated in lower income groups, and a positive value when ill health is more concentrated in higher income countries.
Empirically, RII and CI are estimated by regressing a weighted relative measure of health over the weighted relative fractional rank of individuals or groups along socioeconomic dimension [31]. The units of analysis in this study are health regions across Canada. Such approach abstracts from inequalities within the region and focuses on the between the region or inter-regional health inequalities. The health regions are ranked based on two alternative measures of income: regional average income and household median income. The regions are also ranked based on their educational status measured by the proportion of people in a region with post-secondary education. Consequently, health inequality indices are estimated for three socioeconomic factors. Each region’s health outcomes are weighted by the relative size of its population. The RIIs and CIs are thus obtained from the slope (β) estimates as in the following weighted least squares regression:
where wi is regional weight, Hi is the health outcome in each region (scaled by the average health outcome across the regions), Ri is the relative rank of each region and ui is the random error term. Since the values of RII and CI are closely related, only those of RII are reported in the paper. 1
4. RESULTS AND DISCUSSION
4.1. Results
Table 2 reports the estimation results for RII for each of the health outcomes LEB, LE65, PNMR, IMR, PMMR, AVMR, OBESITY and SRPH, respectively, estimated along the average income dimension for males and females separately.
Health inequalities between regions based on average personal income.
| Health Outcomes | RII | Confidence Interval (95%) | |
|---|---|---|---|
|
|
|||
| LEB | Male | 0.0372 | (0.0255, 0.0489) |
| Female | 0.0326 | (0.0240, 0.0411) | |
|
|
|||
| LE65 | Male | 0.0883 | (0.0590, 0.1176) |
| Female | 0.0776 | (0.0554, 0.0997) | |
|
|
|||
| PNMR | Male | -0.4163 | (-0.6577, -0.1749) |
| Female | -0.2907 | (-0.5553, -0.0261) | |
|
|
|||
| IMR | Male | -0.2196 | (-0.4933, 0.0542) |
| Female | -0.0169 | (-0.2901, 0.2563) | |
|
|
|||
| PMMR | Male | -0.6827 | (-0.8142, -0.5512) |
| Female | -0.7476 | (-0.8702, -0.6249) | |
|
|
|||
| AVMR | Male | -0.6603 | (-0.8008, -0.5197) |
| Female | -0.7778 | (-0.9096, -0.6461) | |
|
|
|||
| OBESITY | Male | -0.3673 | (-0.5766, -0.1581) |
| Female | -0.6301 | (-0.8254, -0.4347) | |
|
|
|||
| SRPH | Male | -0.2409 | (-0.3689, -0.1130) |
| Female | -0.1714 | (-0.3022, -0.0406) | |
Table 2 shows statistically significant income related health inequalities between regions for all the health outcomes considered except for infant mortality rate (IMR) for both genders. As expected, inequality estimates are positive for life expectancies, indicating that regions with higher average income have longer life expectancies, and inequality estimates for mortality rates or poor health (OBESITY and SRPH) are negative, suggesting that regions with higher average income have lower mortality rates and poor health. Health inequalities are greater in magnitude for avoidable mortality rate (AVMR) and pre-mature mortality rate (PMMR) among the mortality rates, and higher for LE65 than for LEB. The inequalities in life expectancies are greater for men than women, whereas inequalities in PMMR, AVMR and OBESITY are higher for women than men. To make sense of the estimated RII values, consider the estimated value of 0.0372 for LEB for males. This value indicates that going from the region with the lowest average income to the one with the highest, increases LEB for males by 0.0372 relative to the average LEB for males across all the regions. Since this average is about 79 years, this amounts to 2.94 extra years of life. Similarly, an RII value of -0.7476 for PMMR indicates that going from the region with the lowest average income to the one with the highest, reduces pre-mature mortality rate by roughly 0.75 relative to the average PMMR for all regions, which amounts to 191.7 fewer deaths per 100,000 population.
Health inequalities estimates between regions based on regional median household income along with their 95% confidence intervals are reported in Table 3. Health inequality estimates based on median household income are statistically significant for the most part. However, for females, inequalities in life expectancy at age 65 (LE65), infant mortality rate (IMR) and self-reported perceived poor health (SRPH) are not statistically significant. For men, only inequality in OBESITY is not statistically significant. The magnitude of the estimated inequalities follow the same pattern as observed in Table 2. That is, higher inequalities for PMMR and AVMR among mortality rates, and greater inequality in LE65 than in LEB. However, the inequality magnitudes are consistently smaller than those reported in Table 2, except for PNMR and IMR.
Health inequalities between regions based on median household income.
| Health Outcomes | RII | Confidence Interval (95%) | |
|---|---|---|---|
|
|
|||
| LEB | Male | 0.0293 | (0.0168, 0.0417) |
| Female | 0.0154 | (0.0053, 0.0255) | |
|
|
|||
| LE65 | Male | 0.0612 | (0.0296, 0.0929) |
| Female | 0.0247 | (-0.0013, 0.0508) | |
|
|
|||
| PNMR | Male | -0.5459 | (-0.7568, -0.3350) |
| Female | -0.5435 | (-0.7798, -0.3072) | |
|
|
|||
| IMR | Male | -0.2894 | (-0.5411, -0.0378) |
| Female | -0.2186 | (-0.4793, 0.0421) | |
|
|
|||
| PMMR | Male | -0.5749 | (-0.7232, -0.6265) |
| Female | -0.5304 | (-0.6875, -0.3732) | |
|
|
|||
| AVMR | Male | -0.5531 | (-0.7089, -0.3973) |
| Female | -0.5140 | (-0.6849, -0.3431) | |
|
|
|||
| OBESITY | Male | -0.0660 | (-0.2754, 0.1435) |
| Female | -0.2391 | (-0.4640, -0.0142) | |
|
|
|||
| SRPH | Male | -0.2058 | (-0.3359, -0.0758) |
| Female | -0.0728 | (-0.2069, 0.0612) | |
The health inequality estimates along the education dimension are reported in Table 4. The results generally echo the findings as reported in Tables 2 and 3. Aside from prenatal mortality rate (PNMR) and infant mortality rate (IMR), all other inequality estimates are statistically significant for both males and females. Moreover, the magnitudes of the estimates are generally greater than those reported in Tables 2 and 3. This is the case for avoidable mortality (AVMR), OBESITY, and SRPH as well as for life expectancies LEB and LE65. The gendered pattern of inequalities based on education mimic the pattern observed for inequalities based on average income as reported in Table 2. That is, greater inequalities in life expectancies for men, and greater inequalities in PMMR, AVMR and OBESITY for women.
Health inequalities between regions based on education.
| Health Outcomes | RII | Confidence Interval (95%) | |
|---|---|---|---|
|
|
|||
| LEB | Male | 0.0517 | (0.0421, 0.0612) |
| Female | 0.0399 | (0.0325, 0.0473) | |
|
|
|||
| LE65 | Male | 0.1106 | (0.0840, 0.1371) |
| Female | 0.0932 | (0.0732, 0.1131) | |
|
|
|||
| PNMR | Male | -0.2118 | (-0.4481, 0.0254) |
| Female | -0.1705 | (-0.4317, 0.0907) | |
|
|
|||
| IMR | Male | -0.2366 | (-0.4896, 0.0163) |
| Female | -0.1628 | (-0.4241, 0.0985) | |
|
|
|||
| PMMR | Male | -0.6477 | (-0.7852, -0.5102) |
| Female | -0.6690 | (-0.8065, -0.5314) | |
|
|
|||
| AVMR | Male | -0.6802 | (-0.8174, -0.5430) |
| Female | -0.7113 | (-0.8555, -0.5671) | |
|
|
|||
| OBESITY | Male | -0.7552 | (-0.9010, -0.6094) |
| Female | -0.8784 | (-1.0272, -0.7296) | |
|
|
|||
| SRPH | Male | -0.3744 | (-0.4904, -0.2583) |
| Female | -0.3427 | (-0.4611, -0.2243) | |
4.2. Discussion
The findings of the study (as reported in Tables 2-4) support the existence of health inequalities between Canadian health regions along the socioeconomic dimensions of income and education. While the results for median household income and average personal income are comparable, estimated inequalities are somewhat higher along the average personal income dimension. This could probably be due to resource sharing within the household, which would mitigate the income inadequacies at the individual level. Few studies have estimated income related health inequalities in Canada using the CI as a related measure of inequality [19, 22, 32]. However, their different scope, variable definition and methods do not allow for direct comparisons with our results.
More interestingly, health inequalities are greater along the education dimension. Recall that education was measured by the proportion of population in each health region with post-secondary education. Such finding suggests that while income and other economic resources are essential for better health and wellbeing, the capacity to use income and other resources in an informed way is also very important. As the conceptual model (Fig. 1) shows, the capacity to use resources is an important link between resources and health outcomes. Education, especially higher education, is an enabler that enhances people’s capacity to make the most out of their available resources.
The findings of the study also consistently indicate greater health inequality for the health outcomes of pre-mature (PMMR) and avoidable mortality (AVMR) as well as obesity. Such findings reinforce the role of socioeconomic factors in health outcomes apart from the demographic and biomedical factors. That is, socioeconomic factors such as income and education can help reduce preventable mortality and morbidity, especially for women who experience greater inequality in preventable mortality and obesity.
The policy implications of the study are rather self-evident. In order to improve people’s health and reduce health inequalities between communities, we need to ensure that individuals have enough income and other resources to lead a healthy and decent life. Moreover, to enable people to make the best use of their resources, we need to provide them with as much education as needed to enhance their capacity in doing so. Therefore, policies aimed at improving incomes such as living wages (as opposed to minimum wages) and those that facilitate greater access to higher education such as lower tuition fees and other forms of financial support go along away towards improving health and reducing health inequalities for all and more so for women. Fortunately, such policies lie within the provincial jurisdiction, which have authority over the health regions in Canada.
5. CONCLUSION
This study uses aggregate data from over a hundred health regions in Canada to estimate health inequalities along the socioeconomic dimensions of income and education using the Relative Inequality Index (RII). Estimates of health inequality for both men and women are provided for various health outcomes including life expectancies at birth and at age 65, pre-natal and infant mortality rates, pre-mature and avoidable mortality rates, obesity and self-rated perceived poor health. These inequality estimates are reported for three indicators of socioeconomic ranking, namely, average income, median household income and education. The findings of the study support the existence of socioeconomic health inequalities along income and education dimensions, which are particularly pronounced for preventable mortalities (such as pre-mature mortality and avoidable mortality) and morbidity (such as obesity). The latter inequalities are generally greater fro women than men. The findings also reveal the critical role of education as an enabler for using income and other economic resources.
CONFLICT OF INTEREST
The author confirms that this article content has no conflict of interest.
NOTES
1 The CI and RII are related as follows: CI = 2 b σ2R, where b is the estimate of β in the above equation and σ2R is the variance of the relative rank (R) of each region along a socioeconomic dimension.
ACKNOWLEDGEMENTS
Declared none.