All published articles of this journal are available on ScienceDirect.

The Regulatory Effect of Guanylate Cyclase Activator 1C on Osteoclast Differentiation and Function through the RANKL/RANK/OPG Pathway
 iD
Zeyu Sun2 , #
Shengxun Zhang3
Bing Ge1
Jie Liu1 , *
iD
iD
Zeyu Sun2 , #
Shengxun Zhang3
Bing Ge1
Jie Liu1 , *
iD
Authors Info & Affiliations
Abstract
Introduction
This study aimed to investigate the role and mechanism of Guanylate Cyclase Activator 1C (GUCA1C) in osteoclast (OC) differentiation within the context of bone tuberculosis (TB), focusing on the RANKL/RANK/OPG pathway.
Methods
RNA sequencing was performed on peripheral blood samples from 10 treatment-naïve patients with isolated skeletal TB, 10 with pulmonary TB, and 10 healthy volunteers. Bioinformatics analyses (GO, KEGG, PPI network) were employed to identify differentially expressed genes (DEGs). In vitro validation was conducted using THP-1-derived macrophages. Cells were transfected with GUCA1C-overexpression or -knockdown lentivirus, followed by osteoclastogenic induction with RANKL and M-CSF. Osteoclast formation and function were assessed by TRAP staining, Western blot (for RANK, RANKL, OPG proteins), and qPCR for key osteoclast markers (NFATc1, TRAP, CTSK, RANK, RANKL, OPG).
Results
Bioinformatics screening identified 210 unique DEGs in the bone TB group. GUCA1C, enriched in the phototransduction pathway, was highlighted as a key candidate. In vitro, GUCA1C overexpression significantly promoted the formation of TRAP-positive multinucleated osteoclasts and upregulated the mRNA and protein levels of RANK, RANKL, and the transcription factor NFATc1 and its downstream effectors (TRAP, CTSK). While both GUCA1C overexpression and knockdown increased OPG expression compared to the control, the knockdown group exhibited higher OPG levels than the overexpression group. Correspondingly, GUCA1C knockdown attenuated the pro-osteoclastic effects observed in the overexpression group.
Discussion
This study provides the first evidence linking GUCA1C, which encodes the calcium-sensor GCAP3, to bone pathology. We propose that GUCA1C, beyond its known retinal function, may act as a novel calcium-signaling modulator in osteoclast precursors. It appears to preferentially enhance pro-osteoclastic signals (RANKL/RANK) while exerting a comparatively weaker upregulatory effect on the decoy receptor OPG. This differential regulation disrupts the RANKL/RANK/OPG axis balance towards enhanced osteoclastogenesis, potentially contributing to inflammatory bone destruction in bone TB. Thus, GUCA1C represents a potential therapeutic target for mitigating pathological bone loss.
Conclusion
GUCA1C promotes osteoclast differentiation by modulating the RANKL/RANK/OPG signaling axis, identifying it as a potential candidate therapeutic target for bone tuberculosis.
1. INTRODUCTION
Tuberculosis (TB) is a potentially life-threatening disease that has been affecting mankind since ancient times. In the current scenario, millions of people still die of Mycobacterium TB infection every year, making it one of the most pathogenic bacteria in global public health [1]. According to the Global TB report 2025, in 2024, it is estimated that 10.7 million people will develop active tuberculosis [2]. Several gaps in the research exist related to TB pathogenesis and appropriate therapeutic approaches, including drugs for TB and surgical interventions [1, 3-5]. There is a need to address these gaps, or else coping with TB will become a major challenge facing mankind in the future. Bone TB is the most frequent form of extrapulmonary TB with the highest disease incidence, which has been reported to cause inflammatory bone destruction mainly through the abnormal activation of osteoclasts (OC) in the bone tissue in response to the bacterium called Mycobacterium TB (MTB) [6, 7]. Among the various forms of bone TB, spinal TB exhibits certain changes in the late stages, such as joint destruction, instability, and compression of the nerve cord, which often requires surgical intervention. This results in increased financial burden due to the high costs incurred by the patients, as well as physical burden caused by the considerable amount of disability after the surgery. However, the molecular mechanism of OC activity induced by TB MTB has not been clearly explained in the previous research [8, 9]. Hence, we designed this study that combined bioinformatics with molecular biology methods to establish a theoretical foundation for novel therapeutic strategies targeting pathological osteoclast activity in bone TB. The study aimed to explore the mechanism of guanylate cyclase activator 1C (GUCA1C) in the regulation of osteoclast (OC) function and differentiation via the RANKL/RANK/OPG pathway.
2. MATERIAL AND METHODS
2.1. Sample Extraction
This study was approved by the Ethics Committee of Guizhou Provincial People's Hospital (Approval No.: Lun Shen Zi [2019] No. 44). All procedures were conducted in accordance with the principles of the Declaration of Helsinki. A total of 30 participants were enrolled, comprising 10 treatment-naïve patients with isolated skeletal tuberculosis, 10 treatment-naïve patients with isolated pulmonary tuberculosis, and 10 healthy volunteers. Written informed consent was obtained from all participants. Participants aged 16 to 50 years, regardless of sex, were eligible. They were divided into three groups: Isolated Pulmonary Tuberculosis Group (n=10,The group consisted of 5 male and 5 female participants): Patients with active pulmonary tuberculosis were diagnosed according to the Chinese National Health Commission's Diagnostic Criteria for Pulmonary Tuberculosis(WS 288-2017). All patients were treatment-naïve and were excluded if extrapulmonary tuberculosis was present. Diagnosis and screening were performed by senior physicians with over 10 years of experience in tuberculosis management, based on comprehensive clinical, radiological, and symptomatic assessments. Isolated Skeletal Tuberculosis Group (n=10,The group consisted of 7 male and 3 female participants): Patients with skeletal tuberculosis were diagnosed using the same WS 288-2017 criteria. Patients were also treatment-naïve and were excluded if concomitant pulmonary or other forms of extrapulmonary tuberculosis were detected. The screening process was identical to that of the pulmonary tuberculosis group. Healthy Volunteer Group (n=10,The group consisted of 5 male and 5 female participants): Individuals with a negative T-SPOT.TB (interferon-gamma release assay) result, no clinical history of tuberculosis disease, and no bacteriological or radiological evidence of active tuberculosis infection. All participants were screened and excluded for the following conditions: HIV infection, primary or secondary osteoporosis, and severe cardiopulmonary diseases or other systemic immune disorders. Participants were withdrawn from the study under either of the following circumstances: Voluntary request by the participant. For patients in the skeletal tuberculosis group who subsequently underwent surgical intervention, intraoperative samples obtained from the lesion site were subjected to acid-fast staining, polymerase chain reaction (PCR), and histopathological examination. Participants whose results were not confirmatory for tuberculosis were subsequently excluded from the study.
30 samples (10 samples each from the untreated patients with simple bone TB, untreated patients with simple TB, and healthy volunteers) with good RNA integrity were collected from patients admitted to the hospital, based on RNA quality detection, with a concentration >40 ng/μL, a total amount >0.8 μg, 28S/18S range from 0.8 to 2.4, and a RIN value >6.5. Written informed consent was obtained from all participants before enrollment, and all procedures involving human samples were conducted in accordance with the ethical standards of the Declaration of Helsinki.
This study employed a total sample size of n=30, with 10 participants allocated to each group (isolated skeletal tuberculosis, isolated pulmonary tuberculosis, and healthy volunteers). The sample size was determined based on the following considerations: (1) the relative rarity of treatment-naïve isolated skeletal TB cases in clinical practice, which posed a practical challenge for recruiting a larger number of eligible patients within the study timeframe; and (2) the exploratory nature of this investigation, which aimed to preliminarily identify key differentially expressed genes and their potential functions in bone TB through an integrated bioinformatics screening and in vitro validation approach.
Due to the relative rarity of treatment-naive isolated skeletal tuberculosis cases, participant recruitment and sample collection were conducted over an extended period from 2019 to 2022. A total of 12 whole blood samples from eligible patients with isolated skeletal tuberculosis were initially collected. Following rigorous RNA quality control, two samples were excluded for not meeting the predefined quality thresholds (concentration >40 ng/μL, RIN >6.5, etc.), resulting in 10 qualified samples being enrolled in the final isolated skeletal tuberculosis group. The RNA sequencing of all samples was completed in 2022. Subsequently, the in vitro functional validation experiments, including cell culture, transfection, and molecular analyses, were performed throughout 2023.
2.2. Analysis of Biological Information of the Differential Genes
Sequencing was conducted on the DNBSEQ platform, with the Homo sapiens genome from NCBI (version GCF_000001405.38_GRCH38.p12) serving as the reference. Following the acquisition of the raw sequencing data, quality control was performed on the BGISEQ platform (PE150) to filter out low-quality reads, contaminated joints, and bases with high N content. After obtaining the clean reads, they were compared with the reference genome sequence using HISAT and Bowtie2. Finally, basic data analysis was conducted by the Dr. TOM system, which was independently developed by BGI.
KEGG and GO enrichment analyses (P < 0.05) were performed using the Cluster Profile and hypergeometric distribution test of DAVID and the R package to evaluate the major gene functions.
In the screening of differentially expressed genes, the expression difference and statistical significance were considered.
2.3. Experimental Instruments and Reagents
A comprehensive list of the experimental instruments and reagents utilized in this study is provided in Table 1.
| Instruments or Reagents | Brand | Style / Item No. |
|---|---|---|
| Inverted biological microscope | Shunyu | XD-RFL |
| Electro-thermostatic blast oven | Yuejin | HGZF-II/H-101-1 |
| Low-speed spin centrifuge | Shanghai Medical Device Co. | 80-2 |
| Normal PCR amplifier | Tianlong | Genesy 98T |
| Real-time fluorescence quantitative PCR amplifier | Molarray | MA-6000 |
| Nucleic acid detector | Lifereal | F-1100 |
| Electrophoresis apparatus | Bio-rad | 1645070 |
| Electroporator | Bio-rad | BE6085 |
| PH meter | Metter-Toledo GmbH | LP115 |
| ELISA | Biotek | 800TS |
| Automatic chemiluminescence image analysis system | Tanon | 5200 |
| TRAP dyeing liquor | Solarbio | G1492 |
| Microslide | LabServ | 32550 |
| Total RNA extraction kit | Solarbio | R1200 |
| Universal reverse transcription kit | Yisheng | 11141ES60 |
| Real-time PCR fluorescence quantitative kit | Yisheng | 11201ES08 |
| BCA protein concentration determination Kit | Solarbio | PC0020 |
| Dried skimmed milk | BD | 232100 |
| TEMED | Amresco | Amresc00761 |
| HCl | Xinyang Chemical Reagent Factory | GB622-89 |
| SDS | Sinopharm | 30166428 |
| 30% Acr-Bis | Solarbio | A1010 |
| Tris | Sinopharm | 30188216 |
| Glycine | Sinopharm | 62011519 |
| Carbinol | Sinopharm | 10014118 |
| NaCl | Sinopharm | 10016318 |
| KCl | Sinopharm | 10020318 |
| Na2HPO4.12H2O | Sinopharm | 10017618 |
| KH2PO4 | Sinopharm | 10019718 |
| RIPA Lysis Buffer | Beyotime | P0013B |
| Protease phosphatase inhibitor mixture | Beyotime | P1045 |
| 5×SDS-PAGE loading buffer | Beyotime | P0015L |
| Protein marker | thermo | 26617 |
| PVDF membrane | Millipore | IPVH00010 |
| ECL liquid | Beyotime | P0018S-2 |
| Stripping Buffer | Priilai | P1650 |
| RANK antibody | Affinity | DF125324 |
| RANKL antibody | Affinity | AF0313 |
| OPG antibody | Affinity | DF6824 |
| GAPDH antibody | Proteintech | 10494-1-AP |
| Sheep anti-rabbit -HRP | Bioss | bs-0295G-HRP |
| PMA | MCE | HY-18739 |
| M-CSF protein | Offshore | C003 |
| RANKL protein | Offshore | CK63 |
2.4. Cell Culture, Transfection, and Differentiation
We assigned the experimental cells into 3 groups: THP-1 cells+ RANKL/M-CSF (control group, group A); THP-1 cells+GUCA1C overexpression lentivirus+ RANKL/M-CSF (overexpression group, group B); THP-1 cells+GUCA1C knockdown lentivirus+ RANKL/M-CSF (knockdown group, group C). THP-1 cells were maintained in the RPMI 1640 medium (containing 10% fetal bovine serum, 100 U/mL penicillin, 100 mg/L streptomycin) in a 75-mL bottle under standard conditions (37°C, 5% CO2) and subcultured every 3 days. The growth status of the cells was recorded. When the degree of fusion was 70–80%, the upper fluid layer was discarded and washed twice with PBS. The cells were then plated in a 6-well (2 mL/well) climbing plate at a density of 1 x 10⁵, followed by incubation at 37°C in a 5% CO2 chamber for 24 h. The virus titer value was 5E +0.8TU/mL of GUCA1C overexpression lentivirus, with the MOI of 50; the virus titer value was 7E+0.8TU/ mL of GUCA1C-knockdown lentivirus with the MOI of 50. After the lentivirus was transfected according to the abovementioned groups, it was incubated again at 37°C and cultured in 5% CO2 for 24 h.
Cells (1 x10⁵/mL) were planted into a 48-well plate covered with a glass and stimulated with PMA at a concentration of 1 x 10⁷ mmol/L. The non-adherent cells were removed by changing the solution every 2 days, and then stopped after 4 days of stimulation. RANKL (50μg/mL) and M-CSF (50μg/mL) were added to induce differentiation, and the solution was changed every 3 days.
2.5. TRAP Staining
After differentiation and co-culture for 10 days, the cell samples were treated with TRAP staining. The cells were then fixed at 4°C for 30 min, followed by washing and drying. Then, TRAP dyeing liquor was added to the cells and incubated at 37°C in a box to avoid direct light for 60 min. After washing and drying, the staining was observed, and the positively stained cells were counted under the microscope (200X). The positive TRAP staining was detected as OC particles stained purplish-red and with>3 nuclei.
2.6. Western Blotting (WB)
Western blot analysis was conducted to assess the relative expression levels of OPG, RANKL, and RANK proteins across the experimental groups. The samples cultured for 10 days were removed from the refrigerator, lysed on an ice bath for 20 minutes, centrifuged at 12000 rpm at 4°C for 20 minutes, and the supernatant was collected. The protein concentration was determined using the BCA protein concentration determination kit. In accordance with the concentration measurement results, 5× loading buffer and PBS were added to adjust the protein concentration to ensure the consistency of protein concentration across different groups. After adjustment, the samples were loaded after boiling at 95°C for 5 min, and electrophoresis was performed at a constant voltage source. The PVDF membrane was immersed in methanol for 10 seconds and then in a fresh transfer buffer. The transfer process was carried out at 4°C for 200 mA and 90 min (0.45μm). The PVDF membrane was blocked with 5% skim milk prepared in TBST and incubated for 2 hours at room temperature with constant shaking. The corresponding primary antibody was diluted with TBST containing 2% BSA (1:1000 dilution), and the PVDF membrane was immersed in the primary antibody incubation buffer and incubated overnight at 4°C. Next, the PVDF membrane was thrice washed with TBST for 10 min each time. HRP-labeled secondary antibody was diluted with the sealing fluid (1:5000 dilution), and the PVDF membrane was immersed in the secondary antibody incubation buffer and incubated at room temperature for 1 h. Subsequently, the PVDF membrane was washed thrice with TBST for 10 min each time. The enhancement buffer of the ECL reagent was mixed with a stable peroxidase solution at a ratio of 1:1 and dropped onto the PVDF membrane, which was then exposed to an automatic chemiluminescence image analysis system. The exposure results were analyzed using the ImageJ software.
2.7. qPCR Detection
Quantitative real-time PCR (qPCR) was employed to measure the relative mRNA expression levels of key osteoclastogenic markers, including nuclear factor of activated T cells 1 (NFATc1), tartrate-resistant acid phosphatase (TRAP), cathepsin K (CTSK), Osteoprotegerin (OPG), receptor activator of nuclear factor-κB ligand (RANKL), and its receptor RANK.
The RNA was extracted from the cells, which were co-cultured for 10 days, and the mixture (RNase-free ddH2O to 15 μL, 5× gDNA Digester Mix 3 μL, RNA template 10 μL) was prepared in an RNase-free centrifuge tube. The mixture was gently mixed with a pipette. The residual DNA was removed after incubation at 42°C for 2 min. Then, the 4×Hifair® iii SuperMix Plus was directly added to the previous reaction tube to prepare 20-μL of the reverse transcription reaction system. cDNA was obtained after reverse transcription, diluted 10 times, and stored at -20°C for subsequent use. Real-time quantitative PCR reaction conditions followed in this study were as follows: (1) pre-denaturation: 95°C for 5 min, 1 cycle; (2) denaturation amplification: 95°C for 10 s; (3) annealing: 60°C for 20 s; (4) extension: 72°C for 20 s, (2) to (4) was a cycle, and the qPCR required 40 cycles. At the end of the experiment, the test sample was subjected to quantitative statistical analysis by the 2-ΔΔCt method. The primers of the target genes are shown in Table 2.
| - | Primers | Primers (bp) | Amplified Fragments(bp) | |
|---|---|---|---|---|
| GAPDH | F | TCAAGAAGGTGGTGAAGCAGG | 21 | 118 |
| R | GCGTCAAAGGTGGAGGAGTG | 20 | ||
| NFATC1 | F | CTATTCCTGTAACGGTCAAGCGAGAG | 26 | 139 |
| R | CTGCTGAACTGAGTGCTCCAATGT | 24 | ||
| TRAP | F | ATGACCACCTTGGCAATGTCTCTG | 24 | 185 |
| R | AGGCTGCTGGCTGAGGAAGT | 20 | ||
| CTSK | F | TCCATCCATAACCTTGAGGCTTCTCT | 26 | 107 |
| R | AGTCCAGTCATCTTCTGAACCACCT | 25 | ||
| OPG | F | GTGTGAGGAGGCATTCTTCAGGTT | 24 | 275 |
| R | CGAAGGTGAGGTTAGCATGTCCAAT | 25 | ||
| RANKL | F | ATCGTTGGATCACAGCACATCAGAG | 25 | 158 |
| R | GAGGACAGACTCACTTTATGGGAACC | 26 | ||
| RANK | F | GACGCACCTTCTCCACAGTTGAC | 23 | 236 |
| R | AGAGGCACCAGGAATACCATGACAA | 25 | ||
2.8. Statistical Analysis
All statistical analyses were processed using SPSS 19.0 software. Measurement data are presented as mean ± standard deviation (x̄ ± s). Inter-group comparisons were carried out by one-way analysis of variance (ANOVA), with a P-value of less than 0.05 being considered statistically significant.
3. RESULTS
3.1. Bioinformatics Analysis of Differentially Expressed Genes
An average of 6.66 G of data was detected for each peripheral blood sample. The average alignment rates were 92.43% for the genome and 80.60% for the gene set. Overall, 17,860 expressed genes were detected. (1) There were 161 upregulated differential genes and 292 downregulated differential genes in the bone TB patients when compared with those of the healthy volunteers (Fig. 1). (2) There were 5 upregulated differential genes and 83 downregulated differential genes in the bone TB patients when compared with those of the TB patients.
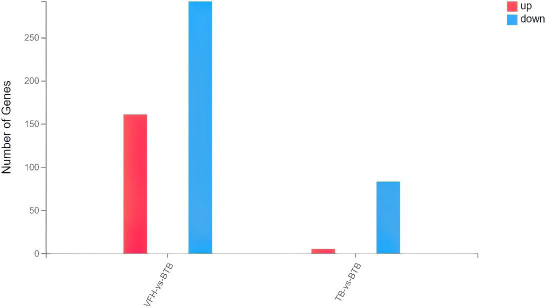
Statistical analysis of the number of differentially expressed genes. VFH:Healthy Volunteers group; BTB: untreated patients with simple Bone TB group; TB: untreated simple TB group.
3.2. Venn Diagram
The Dr. TOM system, invented by Shenzhen BGI Technology Service Co., LTD (available online: https://biosys.bgi.com/#/report/login), was used to collect the differential genes in the abovementioned 3 groups of data and depicted in a Venn diagram. The results revealed 16,385 genes in the 3 groups, with 189 genes in the bone TB and the TB groups, and 241 genes in the healthy volunteers. In addition, 210 differentially expressed genes (DEGs) were detected in the bone TB group alone (Fig. 2 and Table 3). |log2FoldChange| > 1 and FDR-adjusted P-value < 0.05.
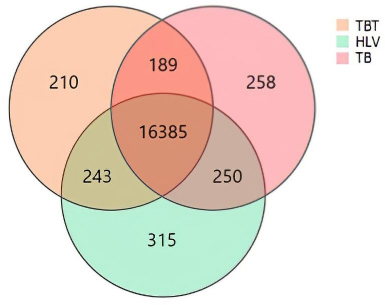
Venn diagram depicting the differential gene expression in the 3 groups. HLV:Healthy Volunteers group; TBT: untreated patients with simple Bone TB group; TB: untreated simple TB group.
| DEGs |
|---|
| FCN2 FOXP2 ARSE MATN4 UGT2B15 OR2AT4 CTRB2 CKMT1A CAMK1G PRODH VSTM5 SLC25A48 HS6ST2 FGF12 MTTP HS3ST6 FOXR1 FBXO47 RNF180 LOC105372109 LIN28B C11orf53 MC5R CCDC158 LOC102723623 DIO2 COLEC10 TMEM95 GUCA1C CAMK2A DNAH5 GYG2 CACNA1S CDH22 TMEM100 ADGRF1 CHRNB3 LGI1 NRAP HTR2C SLC6A7 PIK3C2G DYDC2 CLCNKB EYA4 C8B A1CF C11orf87 ZNF536 DDC LOC112268119 UCN3 LOC644215 CATSPERZ OR51I1 DGAT2L6 XKRY2 COX6A2 IL21 LMLN2 SIX3 SOX2 NAT2 USP17L7 SAA4 C7 PSORS1C1 ZNF676 CMA1 IL12B KCNK15 GUCA2A SHISAL2B GUCY2F LOC107987248 TAS2R41 REG1B XKRY LOC105377372 OR4E2 107986803 TAS2R9 OR1D5 OLIG3 OR2T29 ZG16 ONECUT1 OR2T5 112267996 APOH CX3CL1 FGF22 CCL16 KISS1 TFF1 LOC101929738 MMP16 LYNX1-SLURP2 OR13C9 LOC102723730 TEX44 HES2 IFNB1 C11orf44 GPR32 C2orf83 OR10J3 LOC105370295 TNP2 C9 FADS6 CIB3 KIR3DL3 DCAF12L2 BCL2L2-PABPN1 CCL26 IZUMO2 PALM2-AKAP2 105379575 LOC112268080 EN2 CAMK2B IRS4 CLUL1 RNASE7 TMEM210 ZNF705D FAM205C EGFLAM C12orf40 NPY LOC105378947 CPHXL S100G OVOL3 SLC38A4 IGSF21 RFLNA VCX OR6C4 IL17A CAV3 IRX1 SPINK1 GHRH AXDND1 HSD3B2 ARHGAP40 MAB21L1 SMTNL2 ZSWIM2 AGTR1 LOC100288562 DUSP9 ZNF716 LOC100506514 KRTAP5-4 AKNAD1 TAS2R13 CSN2 ADAM7 ADGRG7 KIAA2012 KCNG3 LOC105376791 TAS2R46 ADRA1B HMX2 NGF FRAS1 LOC101929627 FOXI3 GFRA3 RSPO3 IGF2BP1 C10orf90 TBC1D3B UNCX HGFAC POU3F3 CDSN FXYD6-FXYD2 SPATA48 COX4I2 WFDC10B PLA2G10 LIPG NMRK2 DCDC2C SH2D5 BPIFC IGSF1 SPEM2 FANCD2OS DEFB127 TMEM132B CACNG7 CH25H HOXC9 SLC26A9 C9orf57 KHDC3L LRRC31 CLDN34 ITGB6 PDE10A LOC107986554 HGC6.3 LYPD6 ARX |
3.3. GO Analysis
GO analysis was performed for all 210 DEGs by the DAVID website, the Cluster Profile of R package, and the hypergeometric distribution test. The results revealed that the (1) biological process (BP): DEGs were mainly enriched in the G protein-coupled receptor signaling pathway; the regulation of the signal receptor activity; system process; cell proliferation in the forebrain and cyclic-nucleotide-mediated signaling; (2) cell composition (CC): DEGs were significantly enriched in the membrane attack complex; calcium and calmodulin-dependent protein kinase complex; pore complex; L-type voltage-gated calcium channel complex, and voltage-gated calcium channel complex; (3) Molecular function (MF): DEGs enrichment in the receptor regulatory activity; receptor-ligand activity; G protein-coupled receptor activity; signal receptor activity, and molecular transducer activity (Table 4 and Fig. 3). Specifically for BP, we found that DEGs were significantly enriched in the phototransduction pathway (Fig. 4).
| Category | Term | Count | p-Value | FDR |
|---|---|---|---|---|
| GOTERM_BP_DIRECT | GO:0007186~G protein-coupled receptor signaling pathway | 31 | 3.21041E-07 | 0.000925881 |
| GOTERM_BP_DIRECT | GO:0010469~ regulation of signaling receptor activity | 18 | 1.19208E-06 | 0.001718979 |
| GOTERM_BP_DIRECT | GO:0003008~ system process | 38 | 6.26852E-06 | 0.006026141 |
| GOTERM_BP_DIRECT | GO:0021846~ cell proliferation in forebrain | 4 | 6.30275E-05 | 0.045442836 |
| GOTERM_BP_DIRECT | GO:0019935~ cyclic-nucleotide-mediated signaling | 9 | 8.63348E-05 | 0.049797905 |
| GOTERM_CC_DIRECT | GO:0005579~ membrane attack complex | 7 | 2.28414E-05 | 0.00726356 |
| GOTERM_CC_DIRECT | GO:0005954 ~ calcium- and calmodulin-dependent protein kinase complex | 2 | 7.6997E-05 | 0.012242523 |
| GOTERM_CC_DIRECT | GO:0046930 ~ pore complex | 3 | 0.000495869 | 0.052562166 |
| GOTERM_CC_DIRECT | GO:1990454 ~ L-type voltage-gated calcium channel complex | 2 | 0.004795532 | 0.381244764 |
| GOTERM_CC_DIRECT | GO:0005891 ~ voltage-gated calcium channel complex | 3 | 0.006384775 | 0.406071703 |
| GOTERM_MF_DIRECT | GO:0030545 ~ receptor regulator activity | 19 | 1.89392E-07 | 9.52644E-05 |
| GOTERM_MF_DIRECT | GO:0048018 ~ receptor ligand activity | 17 | 1.08246E-06 | 0.000272239 |
| GOTERM_MF_DIRECT | GO:0004930 ~ G protein-coupled receptor activity | 21 | 2.34979E-05 | 0.003939808 |
| GOTERM_MF_DIRECT | GO:0038023 ~ signaling receptor activity | 29 | 3.74849E-05 | 0.00471372 |
| GOTERM_MF_DIRECT | GO:0060089 ~ molecular transducer activity | 29 | 7.54374E-05 | 0.006544142 |
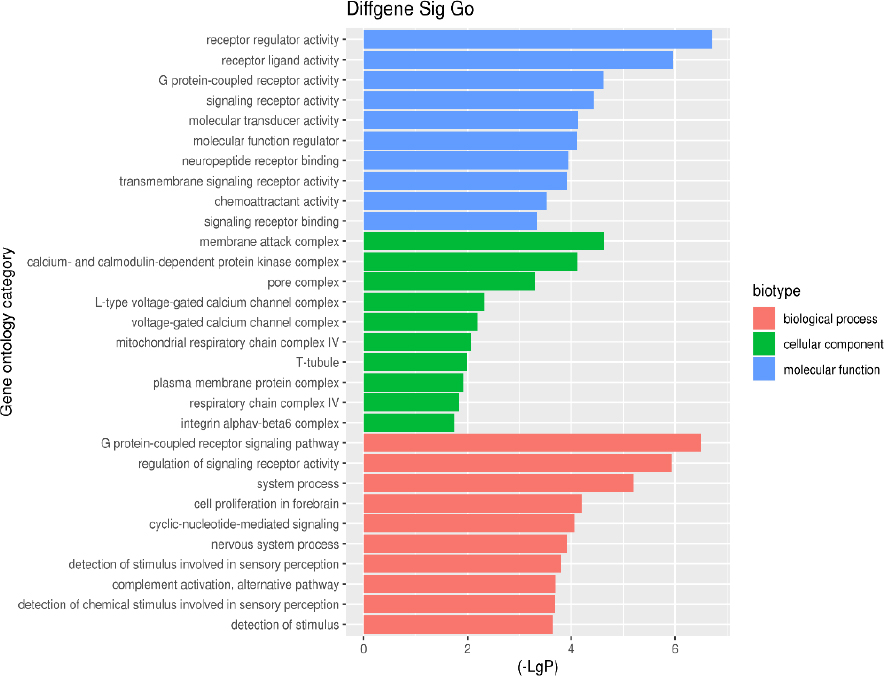
The GO annotation classification of differentially expressed genes in bone tuberculosis.
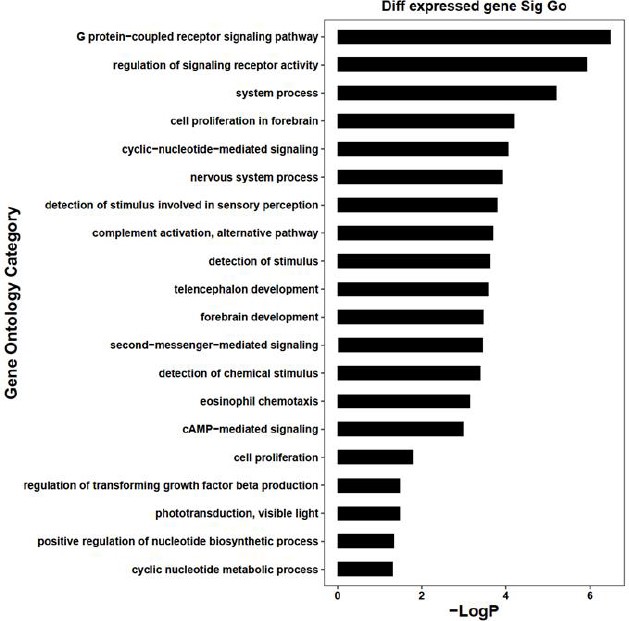
GO analysis of differentially expressed genes in the biological process in bone tuberculosis.
3.4. KEGG Signaling Pathway Analysis
KEGG analysis was performed on all 210 DEGs by the DAVID website, Cluster Profile of R package, and the hypergeometric distribution test. DEGs are enriched in phototransduction, coronavirus disease 2019 (COVID-19), cytokine-cytokine receptor interaction, calcium signaling pathway, and aldosterone synthesis and secretion. The DEGs of phototransduction involved only GUCA1C and GUCY2F. The DEGs of COVID-19 were C8B, C7, IL12B, IFNB1, C9, and AGTR1. The DEGs of cytokine-cytokine receptor interaction were IL21, IL12B, CX3CL1, CCL16, IFNB1, CCL26, IL17A, and NGF. The DEGs of the calcium signaling pathway were CAMK1G, CAMK2A, CACNA1S, HTR2C, FGF22, CAMK2B, AGTR1, ADRA1B, and NGF. DEGs of aldosterone synthesis and secretion were CAMK1G, CAMK2A, CACNA1S, CAMK2B, HSD3B2, and AGTR1 (Table 5 and Fig. 5).
| Path ID | Path Description | P-value | Overlap Gene List |
|---|---|---|---|
| hsa04925 | Aldosterone synthesis and secretion | 0.000624027 | CAMK1G/CAMK2A/CACNA1S/ CAMK2B/HSD3B2/AGTR1 |
| hsa04020 | Calcium signaling pathway | 0.00105521 | CAMK1G/CAMK2A/CACNA1S/HTR2C/FGF22/ CAMK2B/AGTR1/ADRA1B/NGF |
| hsa04744 | Phototransduction | 0.036137181 | GUCA1C/GUCY2F |
| hsa05171 | Coronavirus disease - COVID-19 | 0.038574264 | C8B/C7/IL12B/IFNB1/C9/AGTR1 |
| hsa04060 | Cytokine-cytokine receptor interaction | 0.013793169 | IL21/IL12B/CX3CL1/CCL16/IFNB1/CCL26/IL17A/NGF |
Note: Path ID indicates the KEGG term index number, which is consistent with the KEGG database index number. Path description indicates the description of the KEGG term. P-value evaluates the statistical significance level of gene enrichment in the KEGG term. Overlap Gene List represents the gene enrichment analysis in KEGG.
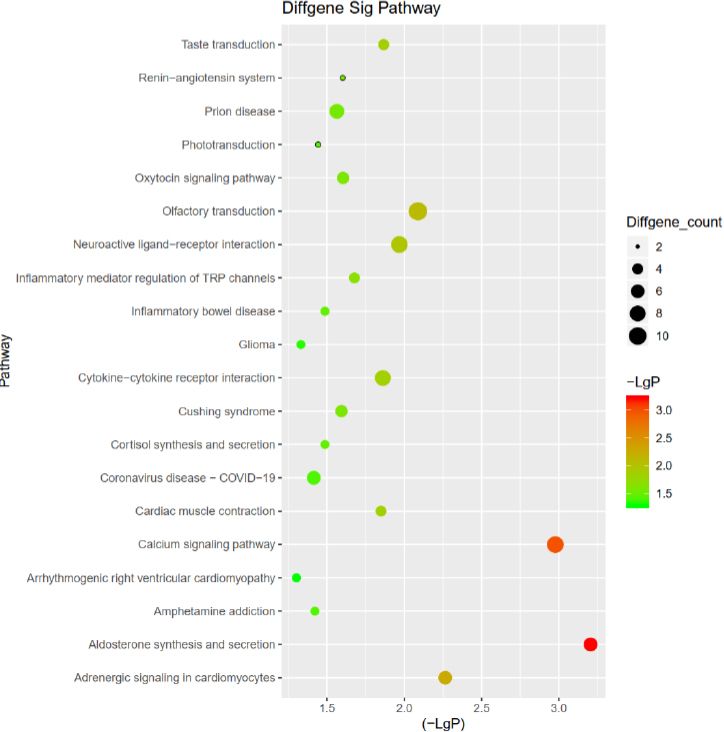
Analysis of the differentially expressed genes in the KEGG signaling pathway.
3.5. PPI Network Analysis
The results of the GO enrichment analysis were compared with those of the KEGG analysis. In both analyses, only phototransduction was involved, and the DEGs were GUCA1C and GUCY2F. Constructing the DEG PPI network through the STRING online database showed 186 DEGs in the DEG PPI network consortium, which also contained the network related to GUCA1C and GUCY2F differential genes in this network diagram. We further confirmed that the DEGs of bone TB were GUCA1C and GUCY2F (Fig. 6). The FPKM of GUCA1C and GUCY2F were 0.08 and 0.02, respectively, as assessed by using the Dr. Tom system.
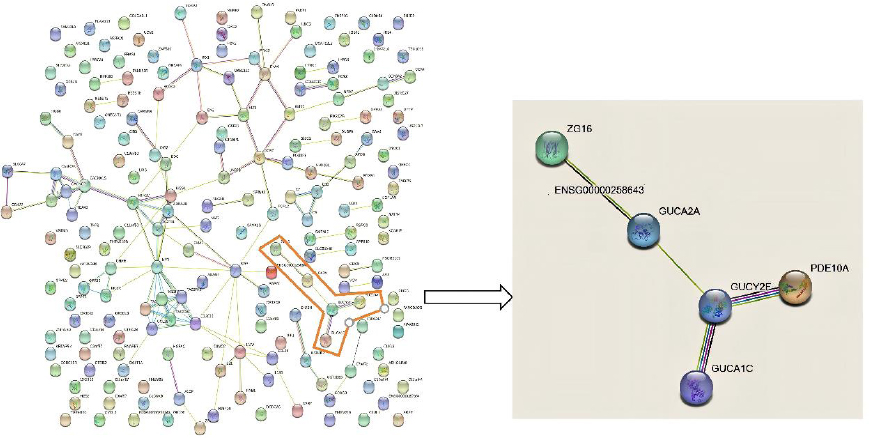
PPI network analysis of DEGs.
3.6. TRAP Staining
After induced differentiation for 10 days, positively multinucleated giant cells were detected in the THP-1 cells by TRAP staining. The large cells showed pseudopodia and protrusions and contained purplish-red particles in the cytoplasm, which indicated the formation of OC (Fig. 7). The number of OCs in the overexpression group was significantly increased relative to that in the control group (P < 0.05). In the knockdown group, it was significantly decreased when compared with that in the overexpression group (P < 0.01). No statistical significance was noted between the knockdown and control groups (P > 0.05) (Fig. 8).
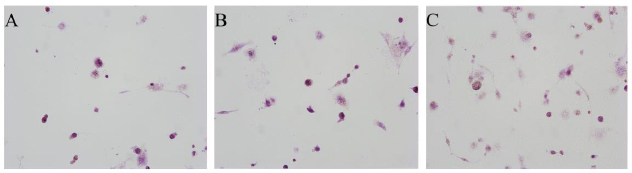
THP-1 cells after inducing differentiation by TRAP staining (×200). A: THP-1 cells +RANKL/M-CSF; B: THP-1 cells+GUCA1C-overexpressed lentivirus+ RANKL/M-CSF; C: THP-1 cells+GUCA1C-knockdown lentivirus+ RANKL/M-CSF.
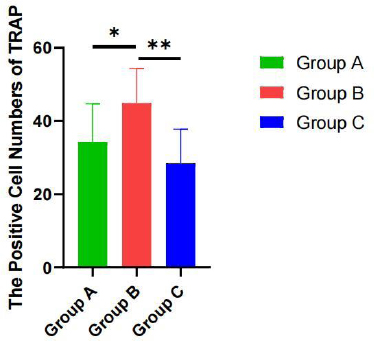
The OC number in the 3 groups by Trap staining. A: THP-1 cells +RANKL/M-CSF; B: THP-1 cells+GUCA1C-overexpressed lentivirus+ RANKL/M-CSF; C: THP-1 cells+GUCA1C-knockdown lentivirus+ RANKL/M-CSF. *P < 0.05,**P < 0.01.
3.7. Expression of OPG, RANKL, and RANK Proteins
Compared with group A, groups B and C showed significantly higher relative expression of RANK, RANKL, and OPG proteins (P < 0.05). Specifically, the levels of RANK and RANKL were further upregulated in group B relative to group C (P < 0.01). In contrast, the expression of OPG was increased in group C compared to group B (P < 0.05) (Fig. 9).
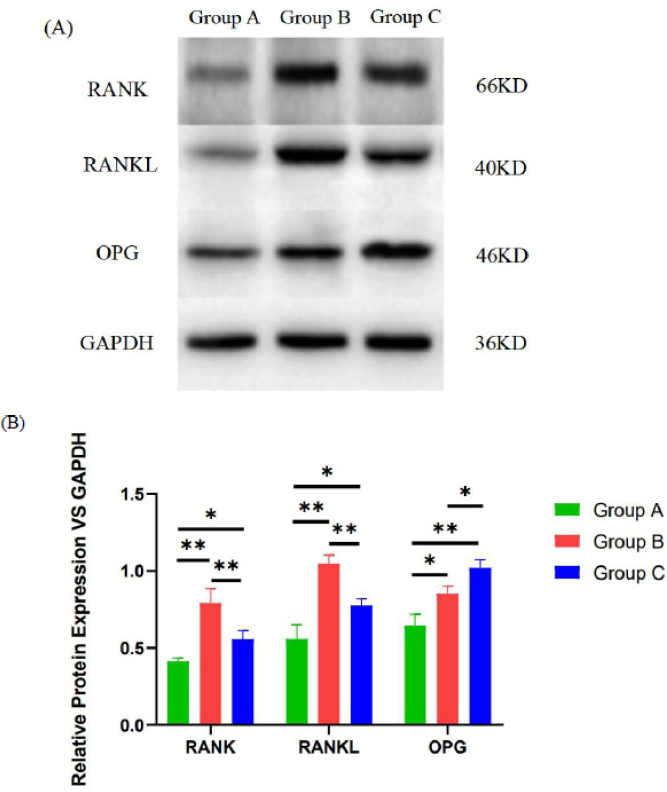
(A) Analysis of RANK, RANKL, and OPG expression in the three study groups by Western blotting. (B) The protein expression changes in RANK, RANKL, and OPG. *P<0.05,**P<0.01.
3.8. Expression of mRNA
The mRNA levels of NFATc1, CTSK, RANK, RANKL, and OPG were significantly elevated in groups B and C compared to group A (P < 0.05). Furthermore, TRAP mRNA expression was upregulated in group B (P < 0.05), while a decreasing trend was observed in group C, though this difference was not statistically significant (P > 0.05). Meanwhile, the mRNA relative expression levels of NFATc1, TRAP, CTSK, RANK, and RANKL in group B were higher than those in group C (P < 0.05, while that of OPG was higher in group C than in group B (P < 0.05) (Fig. 10).
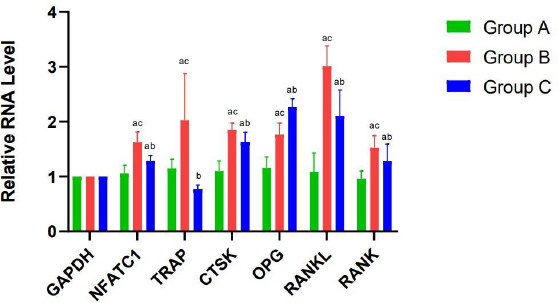
The mRNA expression of NFATc1, CTSK, TRAP, RANK, RANKL, and OPG in the 3 groups. When compared with Group A, aP < 0.05; When compared with Group B, bP < 0.05; When compared with Group C, cP < 0.05.
4. DISCUSSION
This study provides the first evidence elucidating the potential regulatory role of guanylate cyclase activator 1C (GUCA1C) in osteoclast differentiation and function within the context of bone tuberculosis. Our findings demonstrate that GUCA1C is significantly differentially expressed in the peripheral blood of patients with bone tuberculosis. In vitro experiments revealed that GUCA1C overexpression promotes the differentiation of THP-1 cells into osteoclasts and upregulates the expression of key osteoclast markers (NFATc1, TRAP, and CTSK) alongside the RANKL/RANK signaling pathway. Conversely, while GUCA1C knockdown partially attenuated the osteogenic effects induced by overexpression, no statistically significant difference was observed relative to the control group. Notably, GUCA1C exerted divergent regulatory effects on the RANKL/RANK axis versus OPG, suggesting that it may contribute to bone destruction in bone tuberculosis by altering the balance of the RANKL/RANK/OPG axis.
GUCA1C encodes the calcium-sensing protein GCAP3, a molecule whose well-characterized function lies in retinal phototransduction [10-13]. This study identifies, for the first time, an association between elevated GUCA1C expression and enhanced osteoclastogenesis in the context of bone tuberculosis. It is not uncommon for a single protein to exert dual or multiple functions in human diseases. For example, GDF15 is concurrently associated with various conditions, including cardiovascular mortality, diabetes, and dementia [14-16]. This novel finding suggests that GUCA1C’s function extends beyond the retina, potentially involving calcium-mediated signaling pathways critical in other cellular contexts [11]. Osteoclast differentiation is fundamentally dependent on intracellular calcium oscillations, a mechanism that has been experimentally confirmed in multiple studies. As a pivotal intracellular signaling event, calcium oscillations directly regulate the expression of osteoclast-specific genes (e.g., TRAF6, CTSK, MMP9, NFATc1) and influence cell fusion and bone-resorptive function through the calcium/calcineurin/NFATc1 signaling pathway. [17-20], which are triggered by RANKL activation of RANK [21] and are essential for the induction of the master transcription factor NFATc1 [22]. Based on our observations that GUCA1C overexpression upregulates key osteoclastogenic markers (RANK, RANKL, NFATc1, TRAP, CTSK) and promotes TRAP-positive multinucleated cell formation, we hypothesize that GUCA1C may function as a calcium sensor in osteoclast precursors. We propose that GUCA1C may modulate the RANKL/RANK/OPG signaling axis, possibly by influencing cyclic nucleotide signaling (e.g., cGMP) in response to calcium fluxes, thereby fine-tuning the transcriptional program that drives osteoclast differentiation and activation. This proposed mechanism provides a new theoretical foundation for targeting pathological osteoclast activity in bone TB.
Our findings may provide evidence for the new function of GUCA1C and broaden our understanding of its biological function. While the pivotal role of calcium signaling and the RANKL/RANK/OPG axis in osteoclast differentiation is well-established [21, 23, 24], our findings align with this consensus and extend it. However, unlike prior research focusing on classical calcium channels or calmodulin [19, 20, 25], this study provides novel evidence suggesting that GUCA1C, a calcium sensor traditionally regarded as functioning primarily in retinal phototransduction [26] may exert non-classical functions within the skeletal system. To the best of our knowledge, this represents the first demonstration of such a role for GUCA1C. The phenomenon of tissue-specific functional “moonlighting” has biological precedents [27]; this concept helps reconcile the seemingly paradoxical association of GUCA1C with the “phototransduction” pathway observed in the KEGG enrichment analysis. Consequently, it is plausible that GUCA1C serves as a repurposed, conserved calcium signaling module across different cell types.
In theory, bacteria may modulate osteoclast metabolic activity via multiple mechanisms, including direct contact, secretion of virulence factors, induction of immunoinflammatory responses, alteration of bone stromal cell metabolism, and intracellular infection [28]. This study elucidates a previously unreported molecular mechanism underlying pathological osteoclastogenesis in bone TB, shifting the research focus toward cellular signal sensing and transduction—specifically, the intricate regulation mediated by calcium signaling networks. From a clinical translation perspective, GUCA1C and its associated pathway components represent potential therapeutic targets for mitigating pathological bone destruction. Specifically, interventions aimed at modulating GUCA1C expression or activity to restore the balance of the RANKL/RANK/OPG axis could represent a promising strategy for developing novel bone-targeted therapies. Furthermore, as GUCA1C was initially identified as a differentially expressed gene in the peripheral blood of bone TB patients, its expression levels warrant further investigation as a potential non-invasive biomarker for disease activity; however, this application requires rigorous validation through future large-scale clinical studies.
5. STUDY LIMITATIONS
While our integrated analysis offers initial support for GUCA1C's role in modulating osteoclast differentiation through the RANKL/RANK/OPG pathway in bone tuberculosis, several study limitations should be acknowledged.
First, the findings are based on a relatively small sample size (n=30), which may impact statistical robustness and generalizability. Additionally, relying on peripheral blood RNA instead of tissue from actual bone lesions might not accurately reflect the local gene expression and cellular interactions within the complex bone microenvironment.
Second, mechanistic validation primarily utilized an in vitro model with the THP-1 monocytic cell line. While such cell lines offer advantages like genetic homogeneity and ease of manipulation, they may not fully replicate the behavior of primary human osteoclasts or the intricate pathology of a tuberculous bone lesion. Notably, studies indicate that phorbol ester (PMA)-differentiated THP-1 cells do not entirely reproduce the responses of primary human monocyte-derived macrophages. The lack of validation in primary cell co-cultures, more physiologically relevant 3D models, or animal models hinders direct translation of these findings to in vivo conditions.
Third, the research did not analyze correlations between GUCA1C expression levels and specific clinicopathological features of bone TB patients, such as the radiographic extent of bone destruction or treatment response. Furthermore, GUCA1C's role in bone TB needs to be distinguished from its potential function in other osteolytic diseases. Interestingly, population genetics data suggest GUCA1C is unlikely to be dosage-sensitive for haploinsufficiency, indicating that its functional impact might be complex.
To address these gaps, future research would benefit from expanded, multi-center clinical cohorts and direct analysis of bone lesion tissues. Validation should employ more physiologically relevant models, such as 3D culture systems or primary cell co-cultures on bone material. Integrating detailed clinical data with deeper mechanistic studies and multi-omics approaches will be essential to fully evaluate the therapeutic potential of targeting GUCA1C in bone tuberculosis and related disorders.
CONCLUSION
Based on the findings presented, GUCA1C modulates the expression of key regulators within the osteoclastogenic pathway. Specifically, it influences the mRNA levels of OPG, RANKL, RANK, NFATc1, TRAP, and CTSK, alongside the protein expression of OPG, RANKL, and RANK. This regulatory action ultimately promotes osteoclast differentiation via the RANKL/RANK/OPG signaling axis. Therefore, GUCA1C may be a potential candidate target for the treatment of bone tuberculosis.
AUTHORS’ CONTRIBUTIONS
The authors confirm contribution to the paper as follows: J.L. and Z.T.: Study conception and design; Z.S.: Data collection, Formal analysis, and Investigation; S.Z.: Project administration, Software, Validation, and Visualization; B.G.: Resources (Project administration: supporting); Z.T.: Methodology and Drafting of the manuscript; J. L.: Supervision, Funding acquisition, and Critical revision of the manuscript. All authors reviewed the results and approved the final version of the manuscript. Z.T. and Z.S. contributed equally to this work.
LIST OF ABBREVIATIONS
| ANOVA | = Analysis of variance |
| BCA | = Bicinchoninic acid assay |
| BSA | = Bovine serum albumin |
| cDNA | = Complementary DNA |
| CO2 | = Carbon dioxide |
| CTSK | = Cathepsin K |
| DEGs | = Differentially expressed genes |
| DNA | = Deoxyribonucleic acid |
| ECL | = Enhanced chemiluminescence |
| ELISA | = Enzyme-linked immunosorbent assay |
| FBS | = Fetal bovine serum |
| FPKM | = Fragments per kilobase of transcript per million mapped reads |
| GAPDH | = Glyceraldehyde-3-phosphate dehydrogenase |
| GO | = Gene Ontology |
| GUCA1C | = Guanylate Cyclase Activator 1C |
| HIV | = Human immunodeficiency virus |
| HRP | = Horseradish peroxidase |
| KEGG | = Kyoto Encyclopedia of Genes and Genomes |
| M-CSF | = Macrophage colony-stimulating factor |
| MTB | = Mycobacterium tuberculosis |
| NFATc1 | = Nuclear factor of activated T-cells cytoplasmic 1 |
| OB | = Osteoblast |
| OC | = Osteoclast |
| OPG | = Osteoprotegerin |
| PBS | = Phosphate-buffered saline |
| PCR | = Polymerase chain reaction |
| PMA | = Phorbol myristate acetate |
| PPI | = Protein-protein interaction |
| PVDF | = Polyvinylidene fluoride |
| qPCR | = Quantitative polymerase chain reaction |
| qRT-PCR | = Quantitative real-time polymerase chain reaction |
| RANK | = Receptor Activator of Nuclear Factor-kappa B |
| RANKL | = Receptor Activator of Nuclear Factor-kappa B Ligand |
| TB | = Tuberculosis |
| TBST | = Tris-buffered saline with Tween |
| TRAP | = Tartrate-resistant acid phosphatase |
| WB | = Western blotting |
ETHICS APPROVAL AND CONSENT TO PARTICIPATE
This study was approved by the Ethics Committee of Guizhou Provincial People's Hospital (Approval No.: Lun Shen Zi [2019] No. 44).
HUMAN AND ANIMAL RIGHTS
All procedures performed in studies involving human participants were in accordance with the ethical standards of institutional and/or research committee and with the 1975 Declaration of Helsinki, as revised in 2013.
AVAILABILITY OF DATA AND MATERIALS
The data and supportive information are available within the article.
FUNDING
This study has been funded by:
• Guizhou Provincial Science and Technology Project: [2019]2798.
• Science and Technology Plan Project of Guiyang Health Bureau: [2019] Zhu Wei Ji Science and Technology Contract No. 009.
• Science and Technology Association of the Fourth People's Hospital of Guiyang: GYSYKX [2025]03.
ACKNOWLEDGEMENTS
The authors wish to express their profound gratitude to Dr. J for his exceptional and indispensable technical guidance throughout the implementation of this study. We are also deeply saddened by the difficulties he has encountered and extend our heartfelt support and best wishes to him. We would like to thank all the reviewers who participated in the review.