All published articles of this journal are available on ScienceDirect.

An Econometric Study of the Determinants of Canada’s Non-reimbursable Medical Care Costs
Abstract
Introduction
Several studies have assessed the linkages between household factors and non-reimbursable medical costs over the years. However, there still exists a substantial gap in information on non-reimbursable medical costs in Canada that requires addressing. For instance, more information is needed about the extent and variation of the non-reimbursable medical costs across Canada. Even less is known about the prevalence of these costs among different population segments. We use the survey of household spending data to predict non-reimbursable medical costs across Canada’s 10 provinces.
Methods
In order to estimate the predictors of non-reimbursable medical costs in Canada, descriptive assessments and weighted cross-sectional regression analyses were conducted. Regression estimates on the Canadian survey of household spending data were performed to estimate the econometric predictors of non-reimbursable medical costs.
Results
Findings showed significant variation in non-reimbursable medical costs across the country’s 10 provincial regions. More importantly, they show that the share of earnings spent on non-reimbursable medical services is negatively associated with household earnings itself (estimated, coefficient of ln(Earnings) =-0.73, -0.73, -0.85, ∀ p<5% for 2004, 2009, 2015, respectively), while at the same time increasing with agedness (estimated, coefficient of Canadians aged>65 years = 0.58 & 0.82, ∀ p<5% versus Canadians aged < 19 years, for 2004, 2009, respectively), feminine gender (estimated, coefficient of feminine gender =0.28, 0.22, ∀ p<5% versus masculine gender for 2004, 2009, respectively), married status, living in large-sized families, and ill-health.
Conclusion
In Canada, non-reimbursable medical costs differ substantially by province and across socioeconomic, demographic, and health dimensions.
1. INTRODUCTION
For any nation, non-reimbursable medical costs are problematic in a number of ways [1-21]. For instance, a problem relating to non-reimbursable medical costs, as per the World Health Organization, was medical care accessibility challenges for persons who need medical care [1]. Interestingly, sometimes, medical care accessibility can be limited for persons of low socioeconomic status when medical care service providers decide to engage in adverse selection while taking advantage of the medical care information asymmetry existing in some markets [1]. The unaffordability of the medical services and products from high non-reimbursable medical costs can place a heavy burden on government assisted medical services provision. According to WHO [1], a typical problem with non-reimbursable medical spending was the determination of equitable distribution of government-provided medical assistance to eligible recipients, and that higher non-reimbursable medical costs often lead to households having to forego spending on other vital resources of wellbeing such as housing, food, and keeping the house warm in winters. Studies have also associated non-reimbursable medical costs with poverty among patients and households [2, 19, 22-30]. For instance, a study [2] found that extreme non-reimbursable medical costs can often drive individuals into poverty, especially when these medical costs become catastrophic, with few persons in the household earning an income and/or subscribed to health insurance. According to another source [3], non-reimbursable medical costs sometimes lead to non-adherence to treatments (such as missing a medication and/or “not filling a prescription” and “missing doses”) among Canadians. Skipping medication doses due to financial constraints often leads to unintended consequences. Studies have also associated non-reimbursable medical costs with barriers in accessing medical services [31-41]. Similarly, a study [4] found that non-reimbursable medical costs yielded medical access challenges and inequities among citizens of Australia when they studied 5 countries. It also found that extended medical insurance coverages in some of the countries studied shielded patients from challenges stemming from non-reimbursable expenses associated with medical care [4, p309-p322].
Additionally, a study [5] also found that in the US, for example, non-reimbursable medical costs cause a problem of medical access barriers and reduce medical services efficiency. Despite the abovementioned problems associated with non-reimbursable medical costs, limited information still exists on the determinants of these medical costs across Canada’s 10 provincial regions. Below, we discuss and review information on previous articles relating to the determinants of non-reimbursable medical costs.
1.1. Determinants of Non-reimbursable Medical Spending
1.1.1. Socioeconomic Predictors
Past studies have shown that several factors, such as job status, literacy level, and earnings, influence non-reimbursable medical costs. For instance, past studies associated income and non-reimbursable medical costs [42-58]. Findings by some researchers [42, 54, 55, 57, 58] showed that per-capita earnings were negatively associated with non-reimbursable medical costs. For instance, a study [42] found disproportionately higher non-reimbursable medical costs among households of poor socioeconomic status (e.g., a household with low average income). Specifically, their findings revealed high catastrophic non-reimbursable medical costs among poor households, households headed by females, and households with an older person in Canada. Similarly, a study [46] also found that per capita earnings and non-reimbursable medical costs were negatively associated. Additionally, a group of researchers [47] found that low-earning Canadian households would suffer significantly if the provincial governments adopted the 2003 medical care insurance plan, where medications would be availed at a 25% cost-sharing rate on a $12,000 medicinal package. Additionally, the same researchers [47] found that medical care models practised in certain Canadian provinces were better than that of other provinces – attributing their findings to taxation and medical care financing [47, p13]. The above research [47] could mean that employed Canadians with extended employer-provided medical care coverages often spend less in median non-reimbursable medical costs compared to Canadians without employer-sponsored care coverages. The article [47] had limitations in its adherence to a single component of non-reimbursable medical costs (prescription medication costs). It did not also factor in the regulatory heterogeneity in Canada’s 10 provinces. In the United States, for instance, a study [44] associated low-income bracket families with increased non-reimbursable medical costs. Additionally, researchers also found that low-earning oncology individuals in an Eastern Canadian province incurred higher than average non-reimbursable medical care costs while seeking treatment in Ontario when compared with their higher-earning counterparts [52]. Contrary to the findings discussed above, a study [56] showed that non-reimbursable medical costs increased with incomes in the United States of America. The research [56] stressed that low-income families were constrained by their earnings and thus, on average, spent less than their higher-income earning counterparts despite insurance protection. Despite the numerous attempts by past researchers to study the earning-non-reimbursable medical cost linkage above, the studies may have been limited to a number of factors (e.g., focusing on just one type of non-reimbursable medical cost, like dental care, prescription care, and medical care, insurance-based costs [45, 48, 49], recall bias, a small sample size [51], and persons affected by medical conditions [52]). Similarly, the studies may have also been limited in that the Canadian provincial variations in non-reimbursable medical costs stemming from earnings were not assessed.
A few studies have linked years of schooling (or education) to non-reimbursable medical costs [48, 59, 60]. For instance, research [48] mentioned that education level affects an individual’s capability and intent to purchase medical care insurance. Specifically, their finding showed that Canadian individuals with at least a secondary school credential were more likely to afford medical care insurance as compared to their counterparts without (57.5 percent versus 53.5 percent, respectively). Similarly, another study [59] found that possessing more than a secondary school education substantially hiked the odds of both men and women affording medical care from their financial resources (OR=1.7, p-value<1%; OR=1.9, p-value<1%; respectively) compared to just possessing a secondary school education. Additionally, a researcher [60] found a positive correlation between education and non-reimbursable medical costs. The above studies [48, 59, 60] were limited, however by a focus on individual cases of non-reimbursable medical costs as opposed to overall total non-reimbursable medical costs. Additionally, details of education levels were also excluded in the above studies – further contributing to their limitations.
Additionally, previous studies [46, 48, 49, 60, 61] have shown some connection between non-reimbursable medical costs and job status. For instance, a study [60] has demonstrated that non-reimbursable medical costs declined as Albertans gained full-time employment in Canada. Similarly, a study by a team of researchers [48] showed that employer-sponsored extended health insurance coverage lowers the non-reimbursable medical cost met by an eligible Canadian. Past research [61] indicated that employment state and payments for medical care in non-reimbursable medical care costs were associated, whereby persons without jobs were generally more likely to incur higher non-reimbursable medical care costs compared to those with jobs when medical conditions are accounted for. Besides job type, the control over employment was also reported to affect non-reimbursable medical costs. For example, a study concluded that having little say over one’s job stability was associated with cardiovascular conditions, hence leading to increased non-reimbursable medical spending [46]. The above studies, too, were limited to their concentration on a single portion of non-reimbursable medical costs, a location, or a pre-existing condition.
1.1.2. Demographic Factors
Demographic attributes such as years since birth, gender, and marriage, as well as the size of the family and Canadian provincial region, may influence non-reimbursable medical costs. Past studies [46-49, 53, 59, 60, 62-67] showed that age influenced non-reimbursable medical costs. Old age was particularly associated with increased non-reimbursable medical costs [46-49, 53, 59, 60, 63, 64]. One study [60] associated being older than 65 years with reduced odds of paying for medical care from own resources (mean odds ratio, MOR=0.43, p-value<5%)– which is contrary to the majority of the findings by previous authors. The above association became insignificant when the above authors’ conclusions were adjusted for sex (men-MOR=0.38, p-value>5%; women-MOR=0.63, p-value>5%). One could argue that the above studies were also limited by the specific circumstances around which the studies were conducted. Similarly, a study by a team of researchers [62] revealed lower non-reimbursable medical costs among older food-allergic Canadians when compared with food-allergic children. Their finding revealed higher indirect costs associated with medical care. In terms of sex as a demographic factor, a study by [63-68] found that non-reimbursable medical expenses were somewhat more pronounced for women compared to men. Specifically, the research by [63] found that women incurred 40 percent more non-reimbursable costs when compared to men (median women non-reimbursable medical costs $89,741 versus only $64,091 incurred by men over their lifetime in Manitoba, Canada). The limitation of the above research rested on its non-empirical nature, focussing on only Manitoba as a province in Canada and unlikely to have undergone an empirical model diagnostic test. In terms of marital status, an article [48], for instance, revealed that Canadians who are in a marriage carried higher odds of incurring non-reimbursable medical costs compared to Canadians who were not in a marriage arrangement (68.00 percent versus 56.90 percent). The above study [48] also only considered medical care insurance-related premiums, leaving out other non-reimbursable medical cost components. Contrary to the above researchers’ [48] finding, a group of researchers [60] reported that being without a partner, in contrast to having a companion, yielded an insubstantial effect on non-reimbursable medical costs (MOR=0.85, p-value>5%). Including only a few subjects in the research while focussing on only insurable medical costs as a medical care expense contributed to the limitation of the above study.
In reviewed past research, there was an absence of studies covering relationships between family sizes and non-reimbursable medical costs. For example, one study excluded children and seniors when researching family sizes and non-reimbursable medical costs [47]. Similarly, the above pattern, including total exclusion of family sizes was observed in a number of studies looking at non-reimbursable medical costs [60, 69, 70]. In terms of provincial variations, very few articles examined regional and provincial heterogeneity in non-reimbursable medical costs in the country. Relationships between Canadian provincial regions and non-reimbursable medical costs [47-49, 71, 72] have been understudied. If research was undertaken, the focus was limited to consideration of a single non-reimbursable medical cost type, non-reimbursable medical care costs including medicinal drugs [48, 49], a high-level summary study with limited sample size, failure of research to demonstrate provincial regional variation in non-reimbursable medical costs [47], and a substantial level of involvement of other factors such as pre-existing medical conditions, provincial policies (e.g., a model that led to under-involvement in regional provincial medical care coverages), and age [64] were simultaneously observed in the studies.
1.1.3. Medical Determinants
Past research revealed that increased non-reimbursable medical costs were mostly incurred by persons with pre-existing medical conditions in Canada and elsewhere [54, 59, 62, 73-77]. For instance, a group of researchers [62] found that Canadians of all ages experiencing severe food allergy reactions incurred higher non-reimbursable medical costs compared to those with mild or no food allergy. They specifically found that food-allergic children with fair or poor general health status incurred disproportionately higher non-reimbursable medical costs compared with their adult food-allergic and child counterparts in good general health. Similarly, past researchers [59] found that osteo arthritis (OA), a health condition, raised non-reimbursable medical costs for US persons suffering from the condition in the amount of $1,379 for each sufferer. Similarly, other research showed substantially increased per-patient non-reimbursable medical care costs and disease severity in the country [78, 79]. A similar finding was also observed in two other articles [74, 75]. Also, in Eastern Canada, a team of researchers [77] observed a similar finding among sufferers of cancer in Ontario. However, a number of studies, such as those mentioned above, have looked at relations between medical status and non-reimbursable medical expenses; such research excluded the effects of functional and mental medical status on non-reimbursable medical expenses, thereby prompting further research.
This research, therefore, provides several contributions. First, it considers all Canadian provinces in assessing the determinants of non-reimbursable medical expenses in the country. Specifically, this study uses the 10 Canadian provinces as separate categories of independent variables whose effects on the ratio of medical non-reimbursable expenditures to earnings are tested. Secondly, the study also includes households as an independent factor in predicting non-reimbursable medical costs in Canada. Similarly, the study also considers an element of time variation in non-reimbursable medical costs by employing three separate regressions (e.g., 2004, 2009, and 2015 cross-sectional regressions) in its assessment. Unlike in the previously conducted studies, this paper also fills the gap in the existing research by including every non-reimbursable medical expense type (e.g., optometric or eye care-related costs, dentalcare costs, insurable medical costs, as well as prescription drug costs) in the study. This research also considers the inclusion of all Canadian populations as represented by weighted/bootstrapped cross-sectional regressions (unlike as seen in previous research articles). This research uses a very large sample size (n=112,940 Canadians), thereby reducing the problems associated with the use of relatively smaller sample sizes used in previous research articles.
2. DATA AND METHODS
2.1. Data
The data required for this study was accessed through the University of Northern British Columbia’s Canadian Research Data Centre Network (CRDCN) branch with permission from Statistics Canada beginning in the Fall of 2018. Survey of household spending (SHS) data spanning the periods 2004 to 2015 were used for the purpose of this research. SHS datasets between 1998 to 2003 were excluded from this study because estimates of their bootstrap weights were missing. Between 2004 and 2015, a total of 112,940 Canadian households were studied as part of this research from their responses collected via the SHS. The sample of the households reporting in the 2004-2015 SHS dataset who reported negative earnings were truncated and removed from our study analyses. The three Canadian territories of Nunavut, Yukon Territories, and Northwest Territories were excluded from this research as their total SHS share of observations did not meet the CRDCN data release vetting requirement (n<5; sample observations in a given cell were less than 5).
2.2. Methods
Univariate assessments such as bootstrapped averages were performed for the purpose of this research. Similarly, bootstrapped regression analyses were also conducted to assess the determinants of non-reimbursable medical costs by provincial regions in Canada. The total non-reimbursable medical care costs were determined by summing up all the various components of non-reimbursable medical costs, such as medical, dental-related care, and eye-related care costs, amongst others.
2.2.1. Descriptive Analysis
Univariate assessments, such as the bootstrapped average value of non-reimbursable medical costs and ratios, were analysed. Findings from the descriptive assessments informed the choice of variables to be evaluated further in the cross-sectional regression analysis, which will be disfcussed below.
2.2.2. Regression-related Analysis
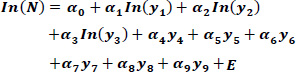
Bootstrapped regression models were conducted for the SHS datasets for the 3 years, 2004, 2009, and 2015, to determine the factors affecting the non-reimbursable medical care costs in Canada. First, a cross-sectional assessment of regressions was run for the male and female genders separately. Secondly, regressions incorporating years since birth were conducted to estimate the effects of age on non-reimbursable medical costs, while both male and female genders were combined. Categorical data were recoded and assigned dummy values in the process of conducting regressions. These variables included but were not limited to perceived medical status, gender, Canadian provincial region, and schooling. Assessment of pairwise-correlations for the independent factors and non-reimbursable medical costs preliminarily helped determine which factors to include in the bootstrapped regressions, specifically those independent factors exhibiting significant relationships with non-reimbursable medical costs. Log-adjusted regressions between the independent factors and non-reimbursable medical costs were conducted for the years 2004, 2009, and 2015. Model 1 below provides the assessment for non-reimbursable medical cost determinants, which was run 3 times for 2004, 2009, and 2015 SHS cycle datasets, while years since birth were considered a continuous variable, and gender was considered separately (Eq. 1).
 |
(1) |
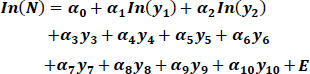
Model 2 below provides an assessment of determinants of non-reimbursable medical costs when the number of years since birth was categorized into 3 categories: < 19 years, 20-34 years, 35-64 years, and > 65 years, for 2004, 2009, 2014 SHS data cycles, taking into account combined sexes (Eq. 2).
 |
(2) |
Where N is the non-reimbursable medical costs to earnings ratio, y1 and y2, are earnings and the size of the family, which were both continuous variables. y3 through y10 are recoded variables for dummy variable grouped attributes such as years since birth, years of schooling, job status, marriage status, Canadian provincial region, self-perceived functional medical state, and self-perceived mental and general medical state. E is the randomized term of error. Years since birth or “age” (y3) was grouped (for the second model, Model 2), comprising < 19 years of age, 20-34 years of age, 35-64 years of age, and > 65 years.
Diagnostic model tests were run, and all the bootstrapped regression models showed no evidence of heteroscedastic error terms (heteroscedastic test, p-value>5%). The cross-sectional nature of this research did not warrant the regression model diagnostic test of autocorrelation (supplementary material).
3. RESULTS AND DISCUSSION
3.1. Descriptive Findings
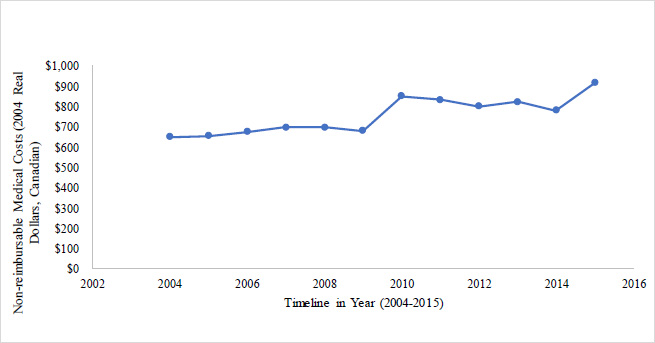
Results from descriptive data analyses revealed a growing trend (2004 to 2015) in Canada's median per-person non-reimbursable medical costs (Fig. 1). An aggressive rise in the non-reimbursable medical costs was observed during the recession (between 2009 to 2010), and a mild decline in 2011, 2012, and 2014. Non-reimbursable medical costs began to rise again after 2014 (Fig. 1).
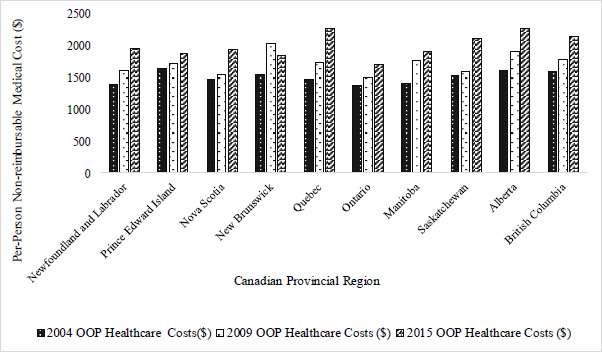
Fig. (2) below compares the average non-reimbursable medical costs in 2004, 2009, and 2015 across the ten (10) provinces in Canada. It shows that non-reimbursable medical costs were highest in the province of Alberta (e.g., mean non-reimbursable medical costs, year: $2,279.82, the year 2015), Quebec (e.g., mean non-reimbursable medical costs, year: $2,285.08, the year 2015), and New Brunswick (e.g., mean non-reimbursable medical costs, year: $1,855.87, the year 2015). Conversely, non-reimbursable medical costs were lowest for Ontario, British Columbia, and Manitoba (see Fig. 2 below) between 2004 and 2015. Over the years, changes in non-reimbursable medical costs revealed positive growth in per capita non-reimbursable medical costs across all provinces except for an isolated case of an 8.9 percent drop in non-reimbursable medical costs in New Brunswick through the years.
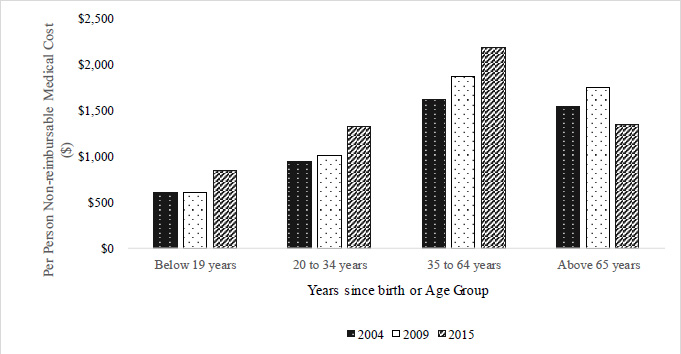
Non-reimbursable medical costs vary among different age groups. Between 2004 and 2015, Canadians in the 35 to 64 age bracket paid the biggest costs in non-reimbursable medical care expenses (Fig. 3), compared with Canadians in other age brackets. The mean non-reimbursable medical cost rose from $1,616 in 2004 to $1,869.60 in 2009 and $2,188.25 in 2015. Conversely, Canadians in the Below 19 years age bracket incurred the lowest average per capita non-reimbursable medical cost during 2005-2015 (mean non-reimbursable medical costs were $608, $603.94, and $847.33 for 2004, 2009, and 2015, respectively). Canadians older than 65 years of age incurred higher average per capita non-reimbursable medical costs compared to Canadians younger than 35 years of age.
3.2. Regression Results
As will later be seen in Tables 1 and 2, the cross-sectional regression models of the log-adjusted share of non-reimbursable medical costs to earnings on socioeconomic, demographic, and health factors yielded interesting findings (Tables 1 and 2 below). In summary, socioeconomics, demographics, and health factors have played substantial roles in predicting the variations of median per-person non-reimbursable medical costs in the country (2004-2015). Results from Tables 1 and 2 below were similar. The discussion section focused on the findings in Table 2 (as it captured age group effects on the non-reimbursable medical costs). Tables 1 and 2 results findings are similar, except for the fact that there were observed individual differences in the covariates on non-reimbursable medical expenses stemming from the difference in the male and female genders.
| Predicated Item | In(NRMC/Earnings) | 2004 SHS | 2009 SHS | 2015 SHS | |||
|---|---|---|---|---|---|---|---|
| - | - | Men | Women | Men | Women | Men | Women |
| - | Independent Covariates/Predictors | (R2=0.292) | (R2=0.40) | (R2=0.295) | (R2=0.383) | (R2=0.426) | (R2=0.39) |
| - | (α, μ) | (α, μ) | (α, μ) | (α, μ) | (α, μ) | (α, μ) | |
| Socioeconomic variables | In(Earnings) | -0.63(0.04)** | -0.83(0.034)** | -0.70(0.05)** | -0.77(0.04)** | -0.86(0.05)** | -0.84(0.06)** |
| Schooling/Education Years | |||||||
| Zero educationβ | |||||||
| Secondary-level education | 1.13(0.53)** | 0.28(0.58) | 0.08(0.09) | -0.46(0.52) | -0.13(0.52) | -0.13(0.33) | |
| Vocational-level certificate (Trade) | 1.24(0.52)** | 0.25(0.60) | 0.24(0.4) | 0.40(0.40) | -0.22(0.51) | -0.41(0.25) | |
| Apprenticeship-license certificate | 0.93(0.56)* | 0.38(0.61) | 0.27(0.09)** | 0.59(0.09)** | -0.24(0.53) | -0.21(0.28) | |
| CEGEP, nursing school diploma, or Community college | 1.28(0.52)** | 0.55(0.58) | 0.31(0.13)** | 0.66(0.14)** | -0.25(0.52) | -0.30(0.26) | |
| Below a university bachelor’s certificate or diploma | 1.40(0.53)** | 0.51(0.59) | 0.28(0.10)** | 0.62(0.11)** | 0.05(0.52) | -0.07(0.29) | |
| Bachelor's degree (B.A., B.Sc., B.Ed.) education | 1.35(0.52)** | 0.60(0.58) | 0.34(0.11)** | 0.64(0.12)** | 0.15(0.64) | -0.55(0.59) | |
| Above a bachelor’s university degree, certificate, or diploma | 1.48(0.53)** | 0.63(0.29) | -0.16(0.41) | 0.84(0.29)** | -0.49(0.51) | -0.60(0.24)** | |
| Job Status | |||||||
| Full-time employmentβ | |||||||
| Part-time employment | -0.11(0.07) | 0.044(0.06) | 0.06(0.08) | 0.050(0.07) | - | - | |
| No employment | 0.04(0.09) | -0.07(0.08) | -0.044(0.11) | 0.02(0.09) | - | - | |
Contents of table adapted from Ogwal’s 2020 MA thesis “Out of pocket expenditures on healthcare across Canadian provinces” [79].
| Predicated Item | In(NRMC/Earnings) | 2004 SHS | 2009 SHS | 2015 SHS | |||
|---|---|---|---|---|---|---|---|
| Men | Women | Men | Women | Men | Women | Men | Women |
| - | Independent Covariates/Predictors | (R2=0.292) | (R2=0.40) | (R2=0.295) | (R2=0.383) | (R2=0.426) | (R2=0.39) |
| - | (α, μ) | (α, μ) | (α, μ) | (α, μ) | (α, μ) | (α, μ) | |
| Demographic factors | In(Age) | 0.80(0.11)** | 1.01(0.10)** | 0.99(0.12)** | 1.10(0.11)** | 0.76(0.15)** | 0.75(0.21)** |
| Marital status | |||||||
| Married-status person β | |||||||
| A person in common-law status | 0.08(0.08) | 0.04(0.08) | 0.05(0.08) | 0.09(0.10) | 0.06(0.12) | -0.062(0.11) | |
| Single-state person (Never married) | -0.57(0.10)** | -0.39(0.09)** | -0.37(0.12)** | -0.54(0.010)** | -0.38(0.16)* | -0.34(0.14)** | |
| Others (separated, divorced, or widowed) | -0.56(0.09)** | -0.47(0.07)** | -0.41(0.10)** | -0.61(0.07)** | - | - | |
| Remainder of marital statuses for 2015 | Male | Female | |||||
| A person who is widowed | - | - | - | - | -0.4(0.20)* | -0.3(0.14)** | |
| A person who is separated | - | - | - | - | -0.44(0.28) | -0.28(0.19) | |
| A person who is divorced | - | - | - | - | -0.64(0.26)** | -0.4(0.16)** | |
| In(Household size) | 0.40(0.06)** | 0.39(0.06)** | 0.50(0.08)** | 0.40(0.07)** | 0.26(0.13)* | 0.35(0.13)** | |
| Province of residence | |||||||
| NL(Newfoundland and Labrador)β | |||||||
| PE(Prince Edward Island) | 0.279(0.10)** | 0.20(0.09)** | 0.15(0.10) | 0.15(0.09) | 0.23(0.24) | 0.002(0.13) | |
| NS(Nova Scotia) | 0.11(0.08) | 0.07(0.07) | 0.15(0.09)* | -0.005(0.08) | 0.15(0.10) | 0.05(0.11) | |
| Demographic factors | NB(New Brunswick) | 0.12(0.08) | 0.18(0.07)** | 0.25(0.08)** | 0.30(0.08)** | 0.01(0.09) | 0.17(0.10)* |
| QC(Quebec) | 0.09(0.08) | 0.15(0.07)** | 0.21(0.08)** | 0.15(0.09)* | 0.28(0.09)** | 0.32(0.09) | |
| ON(Ontario) | -0.35(0.09)** | -0.20(0.08)** | -0.28(0.09)** | -0.30(0.08)** | -0.30(0.11)** | -0.29(0.13)** | |
| MB(Manitoba) | -0.005(0.08) | 0.0005(0.08) | 0.14(0.10) | 0.30(0.09)** | 0.14(0.10) | 0.10(0.10) | |
| SK(Saskatchewan) | 0.11(0.08) | 0.17(0.07)** | 0.06(0.08) | 0.18(0.08)** | 0.09(0.11) | 0.24(0.11) | |
| AB(Alberta) | -0.042(0.09) | 0.13(0.07)* | 0.06(0.10) | 0.15(0.09) | 0.05(0.11) | 0.16(0.13) | |
| BC(British Columbia) | 0.02(0.08) | 0.12(0.07) | 0.006(0.09) | 0.017(0.09) | -0.04(0.11) | 0.11(0.11) | |
Contents of the table adapted from the 2020 work of Ogwal’s MA thesis [79]. Provincial coding such as NL, PE, NS, … were adapted from: https://www12.statcan.gc.ca/census-recensement/2021/ref/dict/tab/index-eng.cfm?ID=t1_8.
| Predicated Item | In[NRMC/Earnings] | 2004 SHS | 2009 SHS | 2015 SHS | ||||
|---|---|---|---|---|---|---|---|---|
| - | - | Men | Women | Men | Women | Men | Women | |
| - | - | (α, μ) | (α, μ) | (α, μ) | (α, μ) | (α, μ) | (α, μ) | |
| Independent Covariates/Predictors | (R2=0.292) | (R2=0.40) | (R2=0.295) | (R2=0.383) | (R2=0.426) | (R2=0.39) | ||
| Perceived functional health | ||||||||
| Physio-functional Health Factors | Yes-sometimes (Functional disability) β | |||||||
| Yes-often (Functional disability) | 0.19(0.12)* | -0.002(0.11) | -0.21(0.14) | -0.06(0.10) | - | - | ||
| No-(Functional disability) | -0.016(0.10) | -0.25(0.10)** | -0.11(0.11) | -0.16(0.09)** | - | - | ||
| Perceived Physio-mental health | ||||||||
| Yes-sometimesβ | ||||||||
| Yes-often (Activity limitation, mental or physical limitation) | 0.17(0.12) | 0.15(0.11) | 0.10(0.14) | 0.08(0.13) | - | - | ||
| No-(Activity limitation, mental or physical limitation) | -0.10(0.10) | 0.12(0.10) | -0.25(0.11)** | -0.15(0.09)* | - | - | ||
| Constantϑ | -1.54(0.74)** | 0.73(0.75) | -0.28(0.69) | 0.11(0.55) | 3.15(0.92)* | 2.96(1.18)** | ||
Contents of the table adapted from the 2020 work of Ogwal’s MA thesis [79].
3.2.1. Non-reimbursable Medical Costs and Socioeconomic Attributes
The relationship between earnings and the share of non-reimbursable medical costs to household earnings was decremental in nature (Tables 1 & 2). Although the general direction of the relationship remained negative, variations in earnings effect on the share of non-reimbursable medical costs to per capita earnings fluctuated between males and females during the select study periods (Table 1). Results showed that for a 10 percent rise in per-person earnings, the share of non-reimbursable medical costs to earnings fell by 7.2 percent (p-value<5%)) in the year 2004, 7.4 percent (p-value<5%)) in the year 2009, and 8.4 percent (p-value<5%) in the year 2015 (Table 2). Effects of schooling fluctuated between 2004 and 2009, despite an overall positive effect being registered. This finding was particularly evident in the year 2004, with the rising effect of schooling continuously increasing as per-capita share of earnings to non-reimbursable medical costs increased. Additionally, the share of non-reimbursable medical costs to earnings, for instance, rose by more than 134 percent (p-value<5%), for secondary education diploma holders, 169 percent (p-value<5%), for undergraduate degree holders, and 194 percent (p-value<5%) for Canadians with more than an undergraduate degree, successively. Similarly, years of schooling yielded a resembling trend as seen above in 2009 as relates to its effects on the share of non-reimbursable medical costs to earnings, despite this effect being less substantial. The effects of schooling on the share of non-reimbursable medical costs to earnings were negligible in 2015. The effect of job status on non-reimbursable medical costs in Canada between 2004 and 2015 was not statistically significant (Table 2).
3.2.2. Demographic Factors
Old age had a substantial effect on the share of non-reimbursable medical costs to earnings in Canada. Canadians older than 65 years saw a median rise of 78.6 percent (p-value<5%) and 127 percent (p-value<5%) in their non-reimbursable medical spending from 2004 to 2009, respectively. In 2015, the effect of old age on the share of non-reimbursable medical costs to earnings was financially inconsequential. The resulting ratio of non-reimbursable medical costs to earnings was disprportionately higher among older women within the same age range as men between 2004 and 2009, except for the year 2015, when model estimations were gender-adjusted. Between 2004 and 2009, gender played a significant role in per capita non-reimbursable medical spending in Canada (Table 2). For the years 2004 and 2009, being a woman rose the per capita non-reimbursable medical costs share to earnings by 32.2 percent (p-value<5%) and 24.6 percent (p-value<5%) when compared to being a man, in Canada, respectively (Table 2). The above finding was, however, negligible for the year 2015 (p-value>5%). Canadians who were single, separated from their partners, divorced from their partners, or widowed by their partners reported smaller shares of non-reimbursable medical care costs to their earnings in the year 2004, compared with Canadians who were married. In single-person Canadian households, a 95.4 percent (p-value<5%) decrease in the share of non-reimbursable medical care costs to earnings was reported. This number was 73.3 percent (p-value<5%) amongst Canadians who were separated, divorced, or widowed, in contrast to Canadians in marriage-state households. Similarly, 82.2 percent (p-value<5%) and 75.1 percent (p-value<5%) decrements were reported for the year 2009, respectively, amongst Canadians in similar marital states. Comparing to Canadians who are married, divorced, widowed, and separated from a partner was associated with reductions in the share of non-reimbursable medical costs to earnings for the year 2015, in the following amounts, respectively: 39.1 percent (p-value<5%), 46.2 percent (p-value<5%) and 58.4 percent (p-value<5%), in the year 2015. Findings showed that Canadians with larger family sizes incurred higher shares of non-reimbursable medical costs compared to those with smaller-sized households (Table 2). Ceteris paribus, a 10 percent rise in family size raised the share of non-reimbursable medical costs to earnings by 39.1 percent (p-value<5%), 44.8percent (p-value<5%), and 25.9 percent (p-value<5%) in years 2004, 2009, and 2015, accordingly. Comparing the results of other provinces to the Canadian province of Newfoundland and Labrador, the shares of non-reimbursable medical costs to earnings varied by province. For instance, the share of non-reimbursable medical costs to earnings was more by 25.9 percent (p-value<5%), 18.5 percent (p-value<5%), 17.4 percent(p-value<5%), and 16.2 percent (p-value<5%) in the Canadian provinces of PE, NB, QC, and SK, successively, comparing to NL. Contrastingly, Canadians residing in ON saw decreased shares of non-reimbursable medical costs to earnings in the amount of 31 percent (p-value<5%) compared to Canadians residing in NL. Similarly, the same findings were seen for the year 2009. Compared to NL, Canadians residing in the provinces of QC, MB, and SK, saw higher shares of non-reimbursable medical costs to their earnings during the year 2015. Contrastingly and repeatedly, the Canadian province of ON consecutively saw lower shares of non-reimbursable medical costs when compared to NL (Table 2).
3.2.3. Health Factors
Compared to Canadians with moderate forms of physio-functional and physio-mental health conditions, Canadians reporting the absence of any medical conditions reported incurring reduced shares of non-reimbursable medical costs by up to 18.5 percent (p-value<5%) in the year 2009 (Table 2). During the year 2004, health influence on non-reimbursable medical spending amongst Canadians was not statistically significant (Table 2). Compared to Canadians with severe occurrence of medical conditions, residents without any health condition reported a 24.6 percent (p-value<5%) reduction in the share of non-reimbursable medical costs to their earnings in the year 2009.
4. DISCUSSION
Canada has a rising trend in per capita non-reimbursable medical costs [80]. The growing trend of non-reimbursable medical costs was unevenly distributed between men and women in Canada, with women reporting higher shares of these costs. The Canadian province of ON reported the smallest per-person non-reimbursable medical expenses between 2004 and 2015 when compared to all other provincial regions in Canada. Contrastingly, the provinces of AB and QC reported the highest per-person non-reimbursable medical costs in Canada from 2004 to 2015. Our findings consequently signal that the economic and financial collapse of the years 2007 through 2009 might have added fuel to the fire increase in the median household non-reimbursable medical expenses in the Canadian provinces, respecting the years 2007 through 2015. Per capita earnings had a negative effect on the non-reimbursable medical care expenses in the country between the years 2004 and 2015. Particularly, low-earning Canadians, on average, paid more in non-reimbursable medical expenses, compared to high-earning Canadians. Generally, Canadians saw higher average medical spending from their own financial resources as they pursued more schooling. Canadians aged 65 years and older generally reported incurring higher non-reimbursable medical care costs compared to their counterparts below the age of 65 years. Bigger family sizes propelled Canadian’s median per-household non-reimbursable medical costs upwards, disproportionately, compared to the case reported in smaller-sized Canadian families. Canadians who reported being widowed, separated, divorced, or single and never married reported incurring lower non-reimbursable medical costs across all of Canada’s 10 provinces. Conclusively, Canadians with medical conditions reported paying higher per-person non-reimbursable medical costs compared to Canadians reporting good perceived health statuses. Our
| Predicated Item | In(NRMC/Earnings) | 2004 SHS | 2009 SHS | 2015 SHS |
|---|---|---|---|---|
| - | - | Men and Women | Men and Women | Men and Women |
| - | - | (α, μ) | (α, μ) | (α, μ) |
| Independent Covariates/Predictors | (R2=0.3668) | (R2=0.3360) | (R2=0.4043) | |
| Socioeconomic factors | In(Earnings) | -0.73(0.03)** | -0.73(0.03)** | -0.85(0.04)** |
| Schooling/Education Years | ||||
| Zero educationβ | ||||
| Secondary-level education | 0.72(0.33)** | 0.28(0l07)** | -0.46(0.36) | |
| Vocational-level certificate (Trade) | 0.78(0.33)** | 0.33(0.21)** | -0.36(0.37) | |
| Apprenticeship-license certificate | 0.58(0.38) | 0.39(0.07)* | -0.23(0.37) | |
| CEGEP, nursing school diploma, or Community college | 0.94(0.33)** | 0.46(0.10)** | -0.31(0.36) | |
| Below is the university bachelor’s certificate or diploma | 0.97(0.33)** | 0.41(0.08)** | -0.03(0.37) | |
| Bachelor's degree (B.A., B.Sc., B.Ed.) education | 0.99(0.33)** | 0.46(0.08)** | -0.05(0.55) | |
| Above a bachelor’s university degree, certificate, or diploma | 1.08(0.34)** | 0.22(0.31) | -0.54(0.35) | |
| Job Status | ||||
| Full-time employmentβ | ||||
| Part-time employment | -0.04(0.04) | 0.05(0.05) | - | |
| No employment | 0.03(0.07) | 0.02(0.08) | - | |
Contents of the table adapted from the 2020 work of Ogwal’s MA thesis [79].
| Predicated Item | In(NRMC /Earnings) | 2004 SHS | 2009 SHS | 2015 SHS |
|---|---|---|---|---|
| - | - | Men and Women | Men and Women | Men and Women |
| - | - | (α, μ) | (α, μ) | (α, μ) |
| - | Independent Covariates/Predictors | (R2=0.3668) | (R2=0.3360) | (R2=0.4043) |
| Demographic-associated variables |
Age group | |||
| <19 yearsβ | - | - | - | |
| 20 - 34 years | -0.14(0.31) | 0.003(0.32) | -0.33(0.54) | |
| 35 - 64 years | 0.22(0.31) | 0.44(0.32) | 0.12(0.53) | |
| > 65years | 0.58(0.32)* | 0.82(0.33)** | 0.32(0.54) | |
| Gender | - | - | - | |
| Menβ | - | - | - | |
| Women | 0.28(0.04)** | 0.22(0.04)** | 0.04(0.06) | |
| Marital status | ||||
| Married-status person | - | - | ||
| A person in common-law status | -0.06(0.06) | -0.02(0.06) | -0.04(0.08) | |
| Single-state person (Never married) | -0.67(0.06)** | -0.6(0.08)** | -0.5(0.15)** | |
| Others (separated, divorced, or widowed) | -0.55(0.05)** | -0.56(0.06)** | - | |
| The remainder of marital statuses for the year 2015 | ||||
| A person who is widowed | - | - | -0.33(0.12)** | |
| A person who is separated | - | - | -0.38(0.15)** | |
| A person who is divorced | - | - | -0.46(0.11)** | |
| In[Household size] | 0.33(0.04)** | 0.37(0.05)** | 0.23(0.09)** | |
| Province of residence | ||||
| NL(Newfoundland and Labrador)β | ||||
| PE(Prince Edward Island) | 0.23(0.07)** | 0.17(0.07)** | 0.08(0.12) | |
| NS(Nova Scotia) | 0.09(0.06) | 0.08(0.06) | 0.11(0.07) | |
| NB(New Brunswick) | 0.17(0.06)** | 0.28(0.06)** | 0.10(0.07) | |
| QC(Quebec) | 0.16(0.06)** | 0.21(0.07)** | 0.32(0.06)** | |
| ON(Ontario) | -0.27(0.06)** | -0.28(0.06)** | -0.27(0.08)** | |
| MB(Manitoba) | 0.02(0.06) | 0.22(0.06)** | 0.12(0.1)* | |
| SK(Saskatchewan) | 0.15(0.06)** | 0.11(0.1)* | 0.18(0.08)** | |
| AB(Alberta) | 0.05(0.06) | 0.10(0.07) | 0.099(0.08) | |
| BC(British Columbia) | 0.08(0.06) | 0.01(0.07) | 0.05(0.08) | |
Contents of the table adapted from the 2020 work of Ogwal’s MA thesis [79]. Provincial coding such as NL, PE, NS, … were adapted from: https://www12.statcan.gc.ca/census-recensement/2021/ref/dict/tab/index-eng.cfm?ID=t1_8
| Predicated Item | In(NRMC /Earnings) | 2004 SHS | 2009 SHS | 2015 SHS |
|---|---|---|---|---|
| - | - | Men and Women | Men and Women | Men and Women |
| - | - | (α, μ) | (α, μ) | (α, μ) |
| - | Independent Covariates/Predictors | (R2=0.3668) | (R2=0.3360) | (R2=0.4043) |
| Physio-functional Health Factors | Perceived functional health | |||
| Yes-sometimes (Functional disability)β | ||||
| Yes-often (Functional disability) | 0.09(0.08) | -0.12(0.09) | - | |
| No-(Functional disability) | -0.15(0.07) | -0.17(0.07)** | - | |
| Perceived physio-mental health | ||||
| Yes-sometimesβ | ||||
| Yes-often (Activity limitation, mental or physical limitation) | 0.17(0.09)** | 0.002(0.10) | - | |
| No-(Activity limitation, mental or physical limitation) | -0.005(0.07) | -0.22(0.07)** | - | |
| Constantϑ | 2.85(0.50)** | 3.47(0.45)** | 5.93(0.71)** | |
Contents of the table adapted from the 2020 work of Ogwal’s MA thesis [79].
research contributes valuable scientific knowledge and data to regulators at all levels of government, academia, medical institutions, and not-for-profit organizations. This research provides useful information that Canadian regulators can use to derive and implement policies that reduce the burden of per capita household non-reimbursable medical spending in the country. The regulators could adopt such policies that aim at offering medical subsidies to vulnerable Canadians, such as Canadians in financially struggling large families, the elderly, women, and children. Similarly, our findings also signal that healthcare policy makers in provinces where Canadians are facing disproportionately higher non-reimbursable medical costs (e.g., Quebec and Alberta) could review their medical expenditure policies in such a way that their provincial medical care cost policies become more aligned with their low-cost counterparts (such as Ontario and British Columbia). Such policy implications and measures could include pro-rated medical care subsidies and government-regulated medical care cost controls (e.g., price ceiling policy in certain healthcare markets) for certain rare but needed medical products or care procedures where there may be a tendency of the healthcare market to become monopolized. Additionally, healthcare policy makers could also adopt favourable universal pharmacare insurance policies to protect the elderly, the vulnerable, as well as women and children, in Canadian Provinces where non-reimbursable medical care costs are rising disproportionately. Another policy implication of this research is that the Canadian medical care regulators could employ non-reimbursable medical cost reduction strategies using a systematic approach that covers the following four main aspects of the medical care system: medical services financing, medical care guardianship, development of more medical care products and services, as well as availing and encouraging more equitable medical care access policies [81-85]. The inclusion of a more comprehensive set of data, including data on medical technological advancement, structural distribution, and regulatory distribution of the Canadian medical services providers, as well as extra-Canadian regulatory influences on the Canadian healthcare markets, is recommended for a more robust and comprehensive study of determinants of non-reimbursable medical costs in Canada. Similarly, being able to include political as well as fiscal variables, such as those identified in the study, might have made the findings of this research more comprehensive.
CONCLUSION
Using three sets of cross-sectional data for the years 2004, 2009, and 2015, we examined the associations of a number of socio-economic, demographic, and health-related factors with the share of earnings spent on non-reimbursable medical costs for patients across Canadian Provinces. Our findings indicate that non-reimbursable costs are negatively associated with earnings or income, implying a regressive cost burden on lower-income people. On the other hand, non-reimbursable costs are found to be increasing with age (particularly those > 65), family size, level of education (for 2004 and 2009 estimates), and ill-health measured both as perceived functional and mental health. The results also indicated that married couples and women had greater non-reimbursable expenses. We found no statistically significant association between non-reimbursable costs and employment status. Such results, as important as they are, should be taken cautiously as they are based on cross-sections of different individuals at different times. We believe panel data of cohort populations, when available, would provide a richer information base for drawing more conclusive results.
AUTHORS’ CONTRIBUTION
J.S.: Contributed to the concept design, literature review, reviewing, and editing of the paper; W.C.: D Reviewing, contribution to literature, and editing; E.O.: Writing the Paper.
LIST OF ABBREVIATIONS
| CRDCN | = Canadian Research Data Centre Network |
| SHS | = Survey of Household Spending |
| UNBC | = University of Northern British Columbia |
AVAILABILITY OF DATA AND MATERIALS
All the data and supporting information are provided within the article.
ACKNOWLEDGEMENTS
We would like to acknowledge Statistics Canada (Stat Can) for granting the corresponding author access to its confidential micro-dataset, the Survey of Household Spending (SHS) Dataset, through the Canadian Research Data Centre Network (CRDCN) at the University of Northern British Columbia (UNBC), Canada. The SHS Stat Can CRDCN Dataset was accessed for the corresponding author’s MA thesis, from where this research has been adapted.
Of Household Spending data) from Statistics Canada, through the UNBC CRDCN.